1. Measuring institutional trade cooperation
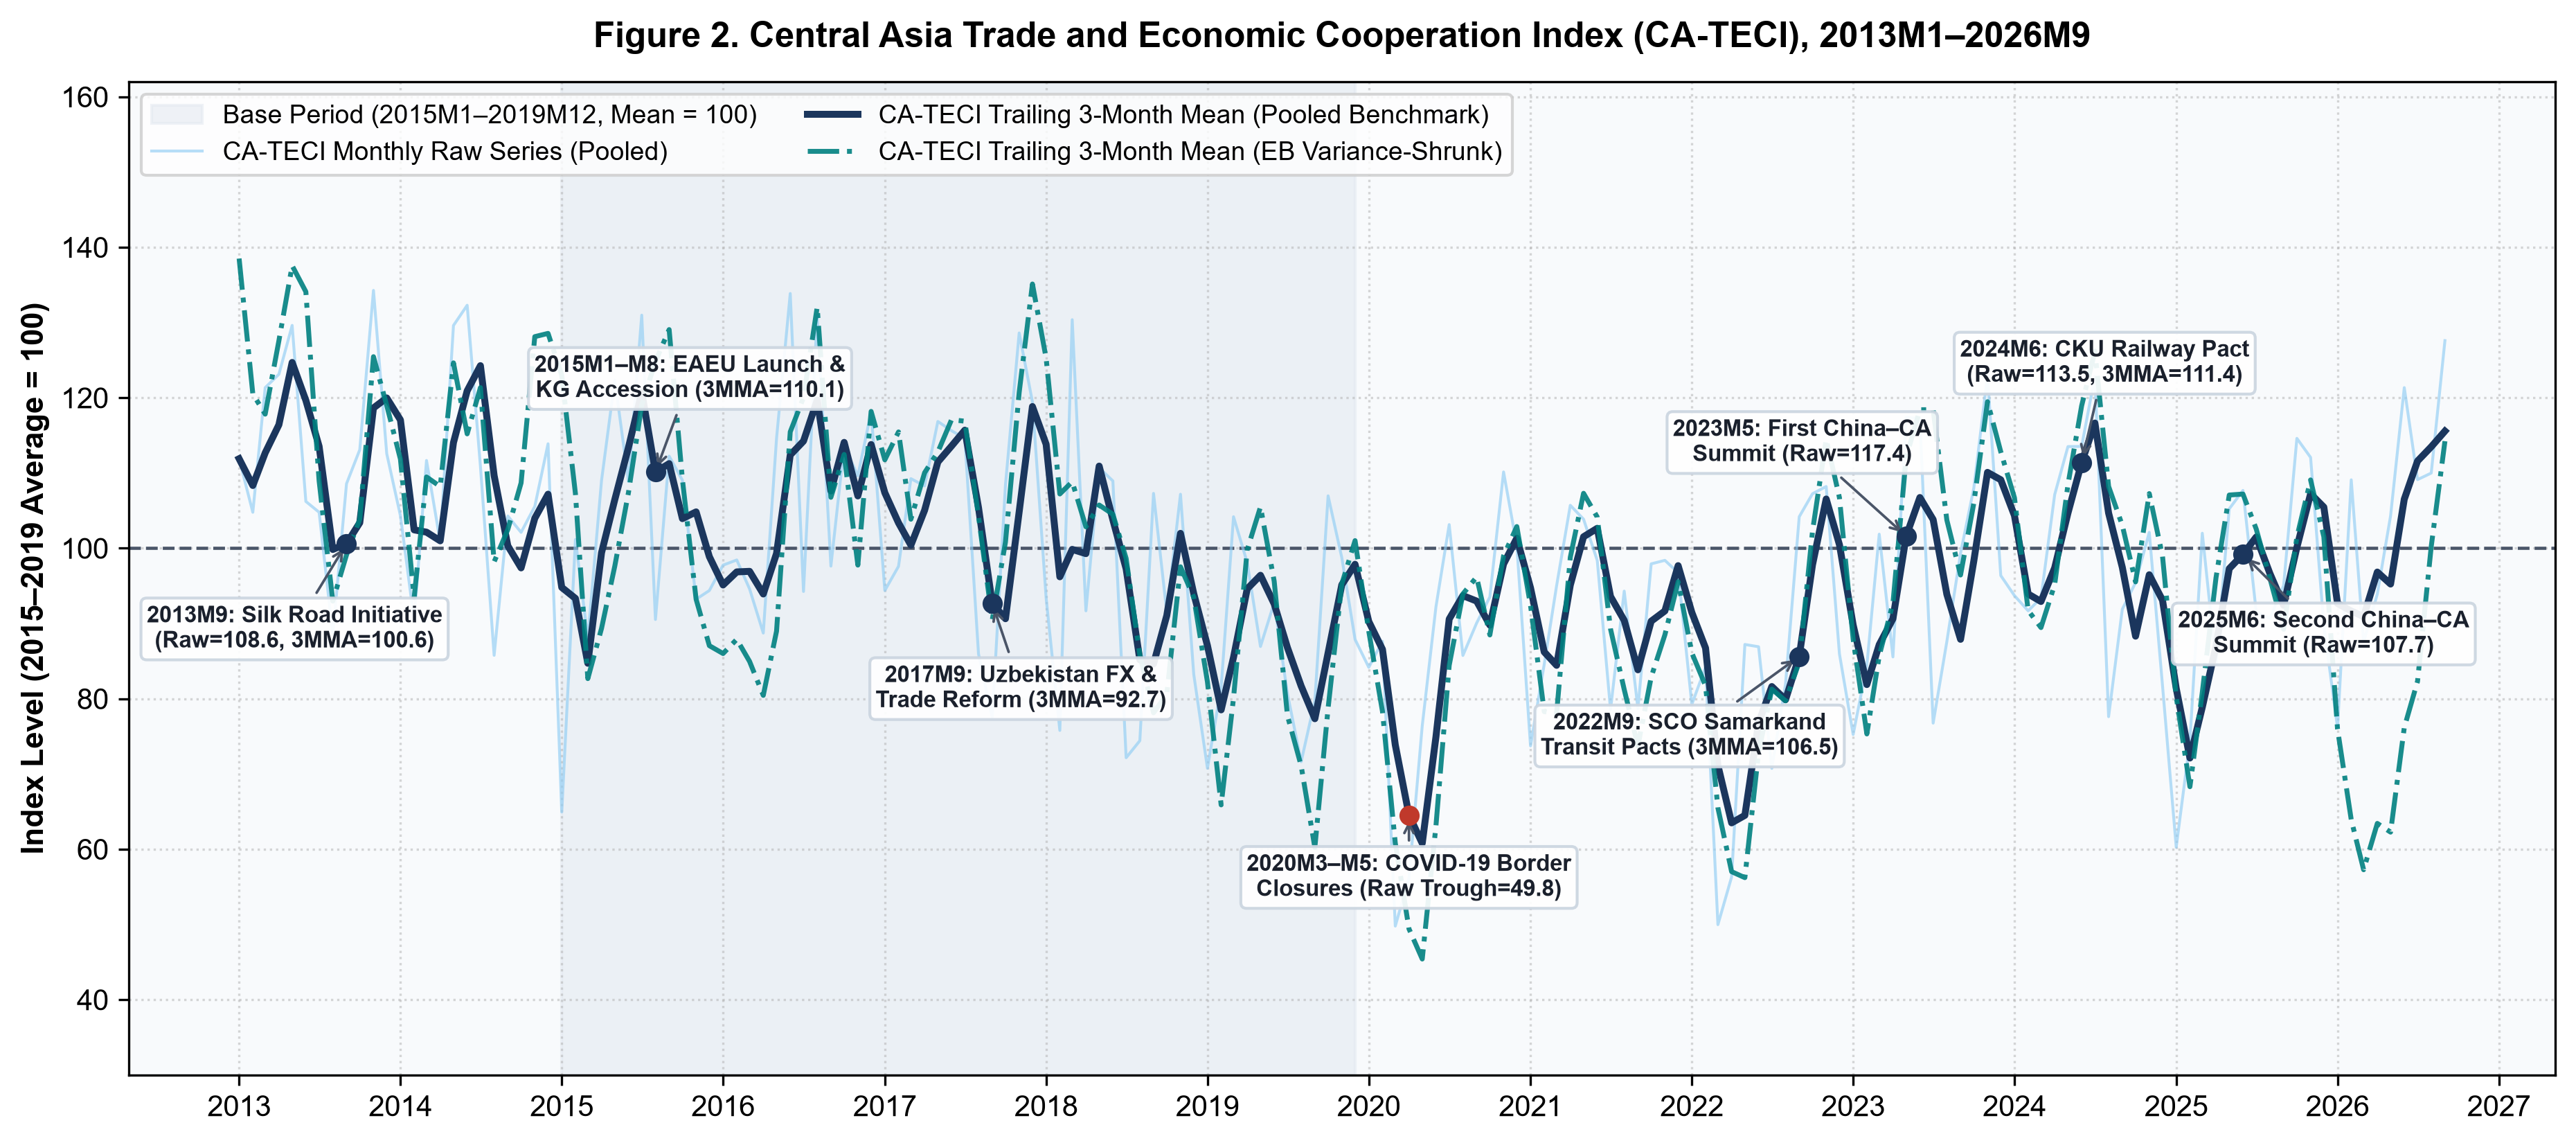
Trade policy uncertainty and institutional cooperation affect the conditions for cross-border exchange. Building on the text-based measurement approach of Baker, Bloom and Davis (2016), CA-TECI measures news coverage of trade agreements, reciprocal tariff concessions, customs facilitation and cross-border infrastructure cooperation. The index supports analysis of changes in institutional cooperation and their relationship with trade flows in Central Asia.
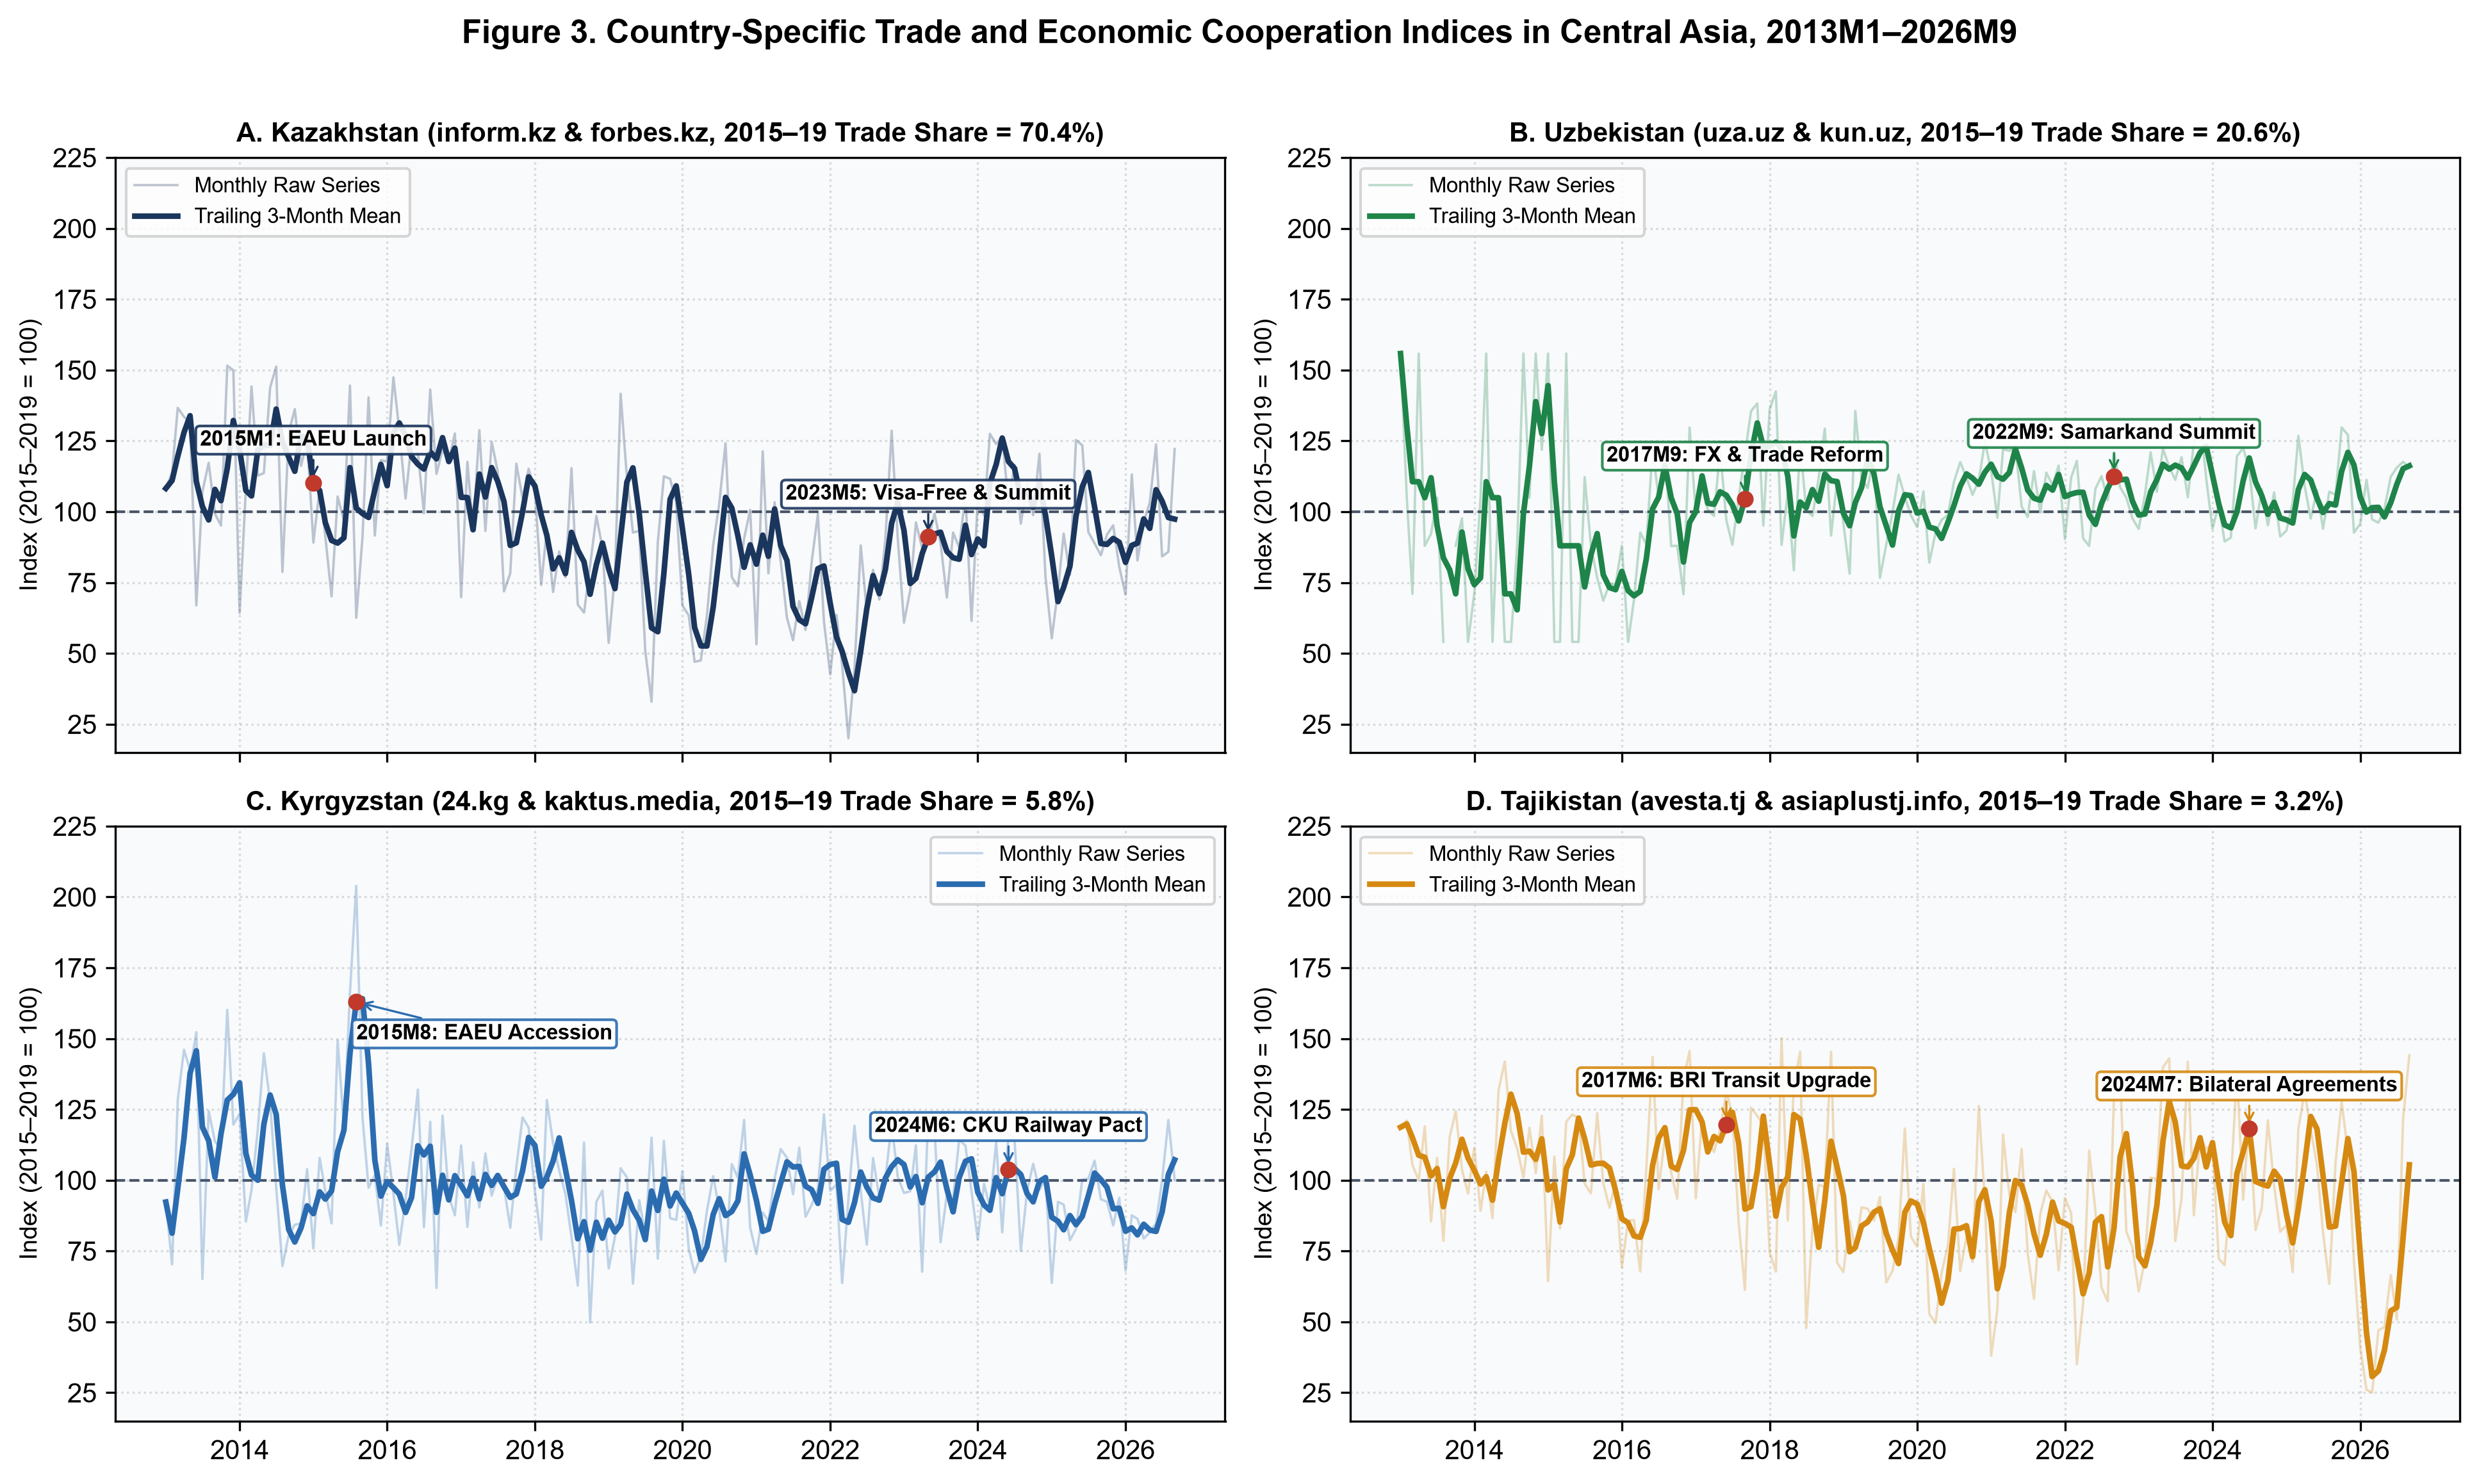
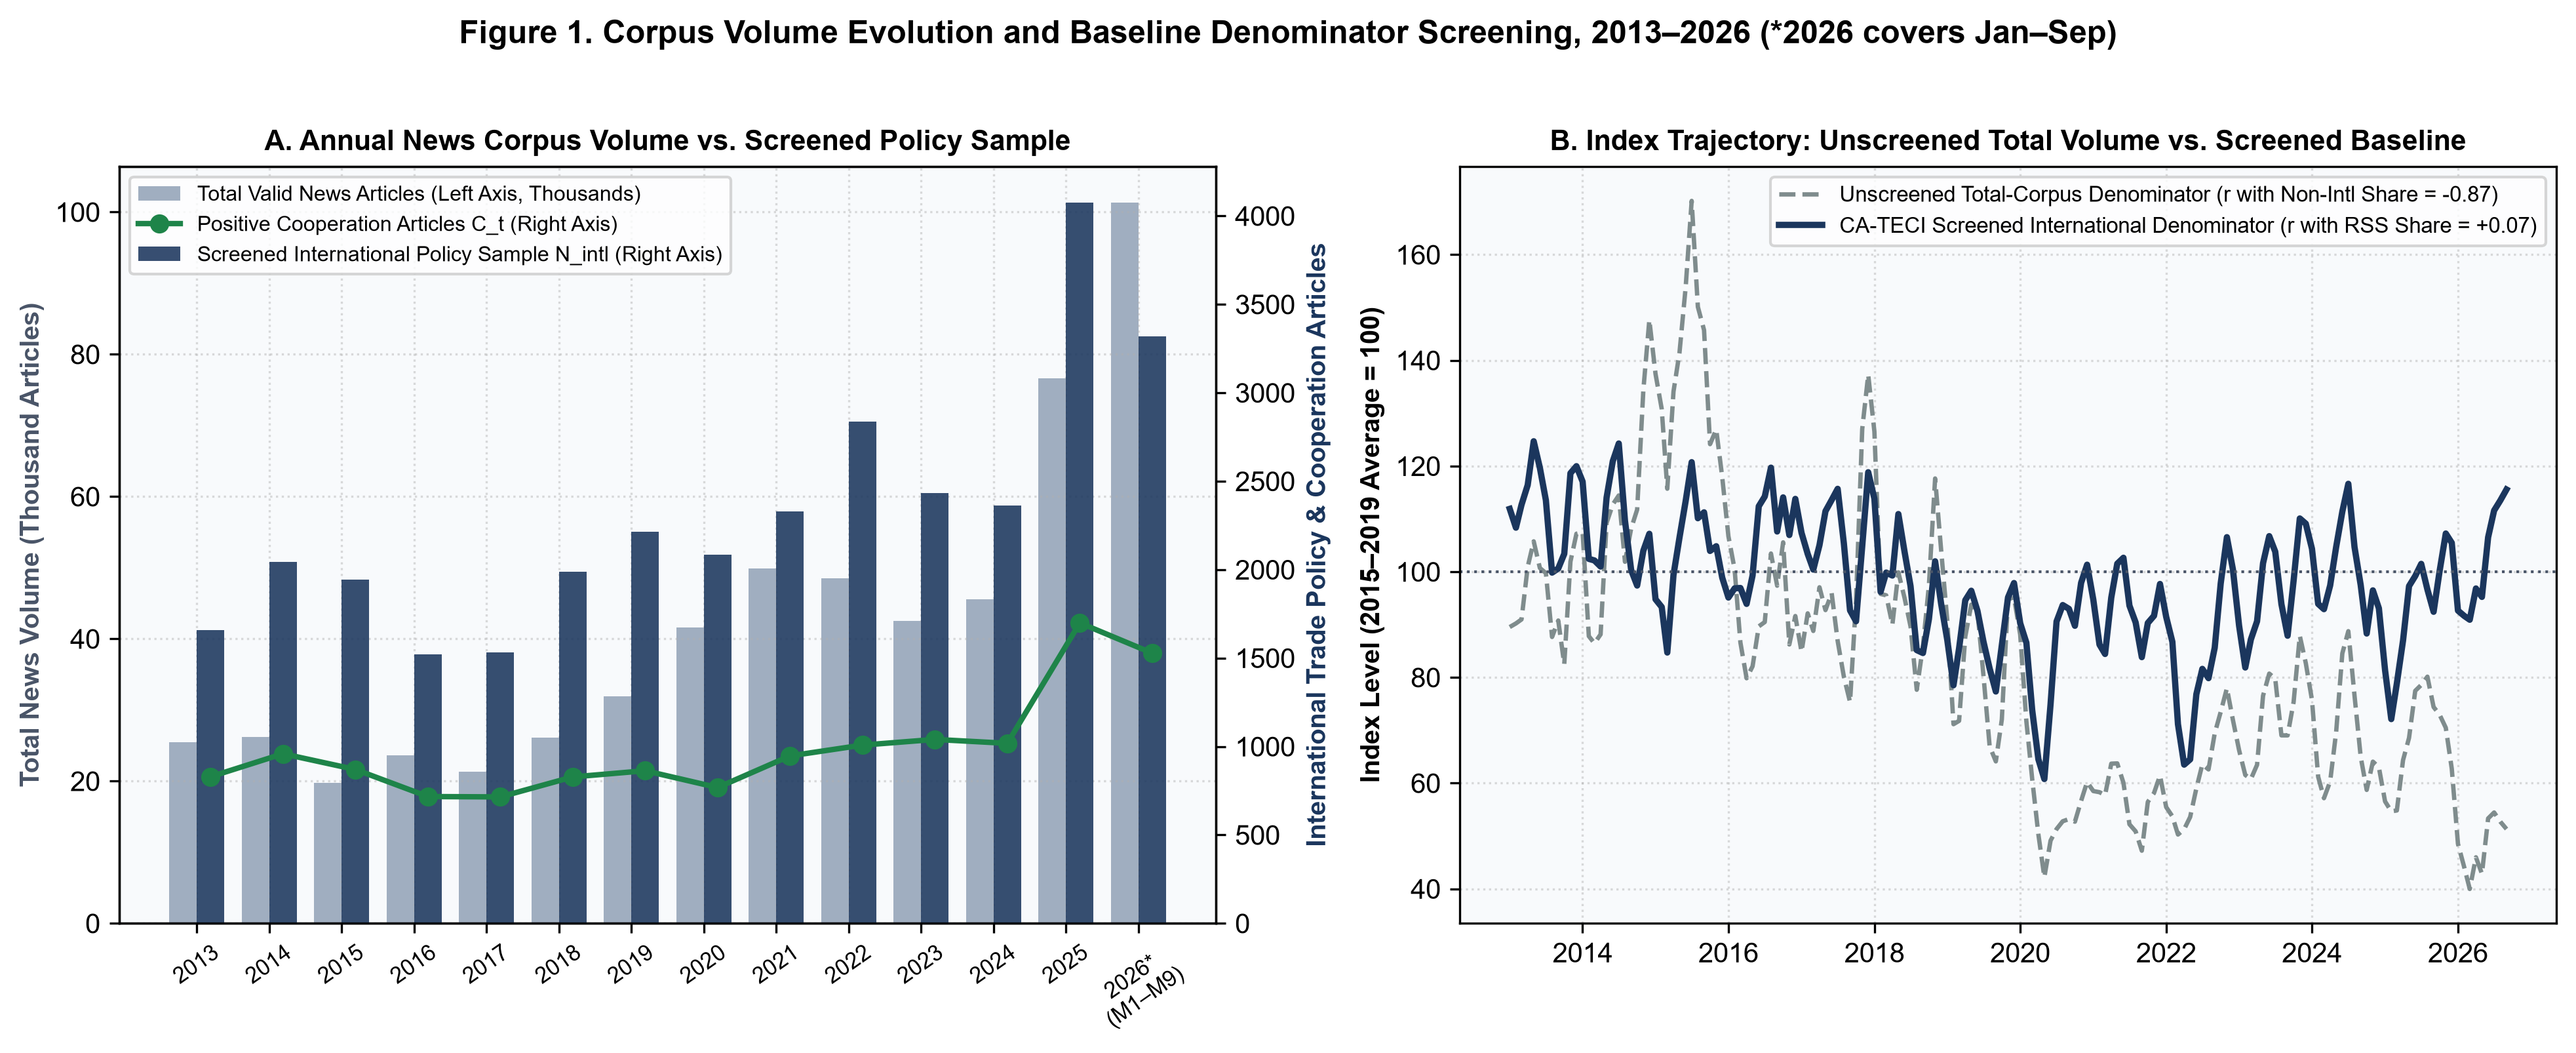
The Central Asia Trade and Economic Cooperation Index (CA-TECI) uses the same sample as CA-TPU: 3,084,775 Russian-language articles from eight outlets in Kazakhstan, Uzbekistan, Kyrgyzstan and Tajikistan, covering January 2013 to September 2026. Both indices use a common base period while measuring distinct dimensions of the trade policy environment.
2. News sample and reference population
CA-TECI uses international trade policy coverage as its reference sample to reduce sensitivity to changes in the volume of social and entertainment reporting. Excluding articles on domestic municipal utility charges yields 32,340 reference articles, . Of these, 6,591 meet the cooperation criteria, , corresponding to 20.38% of the reference sample.
| Country | News outlet | Total articles | International trade policy articles () | Cooperation articles () | Base-period mean share (%) | Base-period SD (percentage points) | Empirical Bayes weight () |
|---|---|---|---|---|---|---|---|
| Kazakhstan (KZ) | Kazinform | 800,664 | 9,472 | 2,299 | 20.47 | 4.68 | 11.21% |
| Forbes Kazakhstan | 147,518 | 3,489 | 496 | 13.06 | 3.78 | 15.29% | |
| Uzbekistan (UZ) | Kun | 295,041 | 3,701 | 594 | 14.54 | 5.42 | 9.43% |
| UzA (National Agency) | 166,464 | 2,824 | 1,013 | 30.29 | 5.12 | 10.25% | |
| Kyrgyzstan (KG) | 24 News Agency | 386,704 | 4,209 | 555 | 13.38 | 4.01 | 13.45% |
| Kaktus Media | 1,090,618 | 3,795 | 428 | 11.15 | 4.34 | 12.22% | |
| Tajikistan (TJ) | Asia-Plus | 114,578 | 2,850 | 580 | 19.86 | 3.93 | 13.87% |
| Avesta | 83,188 | 2,000 | 626 | 30.69 | 3.81 | 14.28% | |
| Regional total / pooled benchmark | 3,084,775 | 32,340 | 6,591 | 17.85 | 3.23 | 100.00% | |
3. Human validation and sensitivity to outlet composition
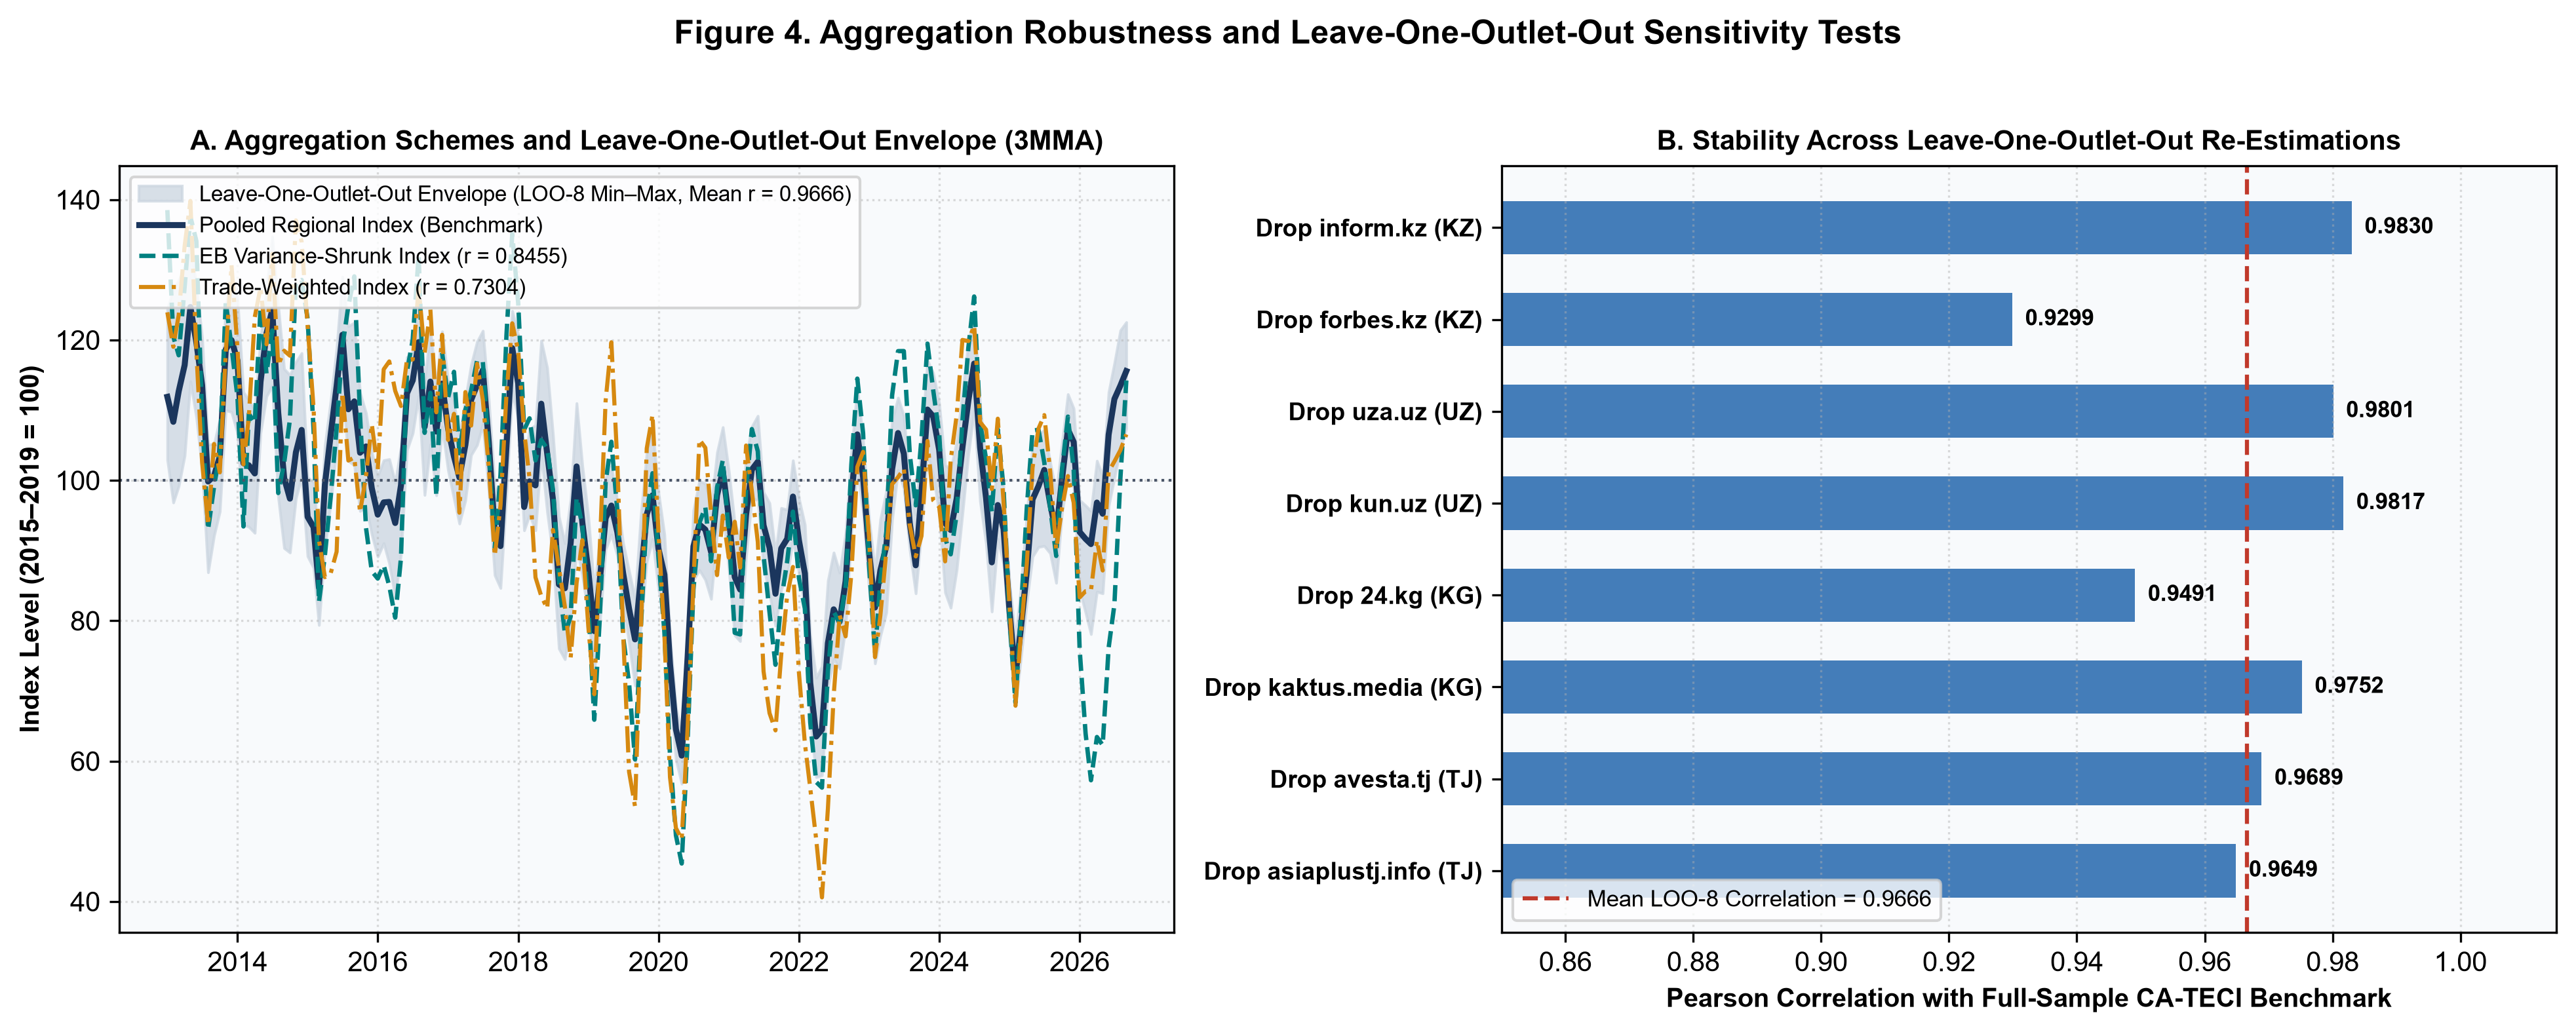
Two researchers independently coded a double-blind stratified sample of 600 Russian-language articles, including 450 observations in the main sample and 150 supplementary observations containing trade restriction or municipal utility terms. Horvitz–Thompson inverse-probability weighting yields a precision estimate of 86.7%, recall of 86.2% and an score of 86.5%. Inter-coder agreement is . Indices constructed by excluding one outlet at a time have correlations of with the benchmark.
KEY ECONOMETRIC FINDINGS
Key econometric findings
Local projections associate higher CA-TPU with export contraction and higher CA-TECI with export expansion.
Cooperation and export expansion
h = 6 · p < 0.01
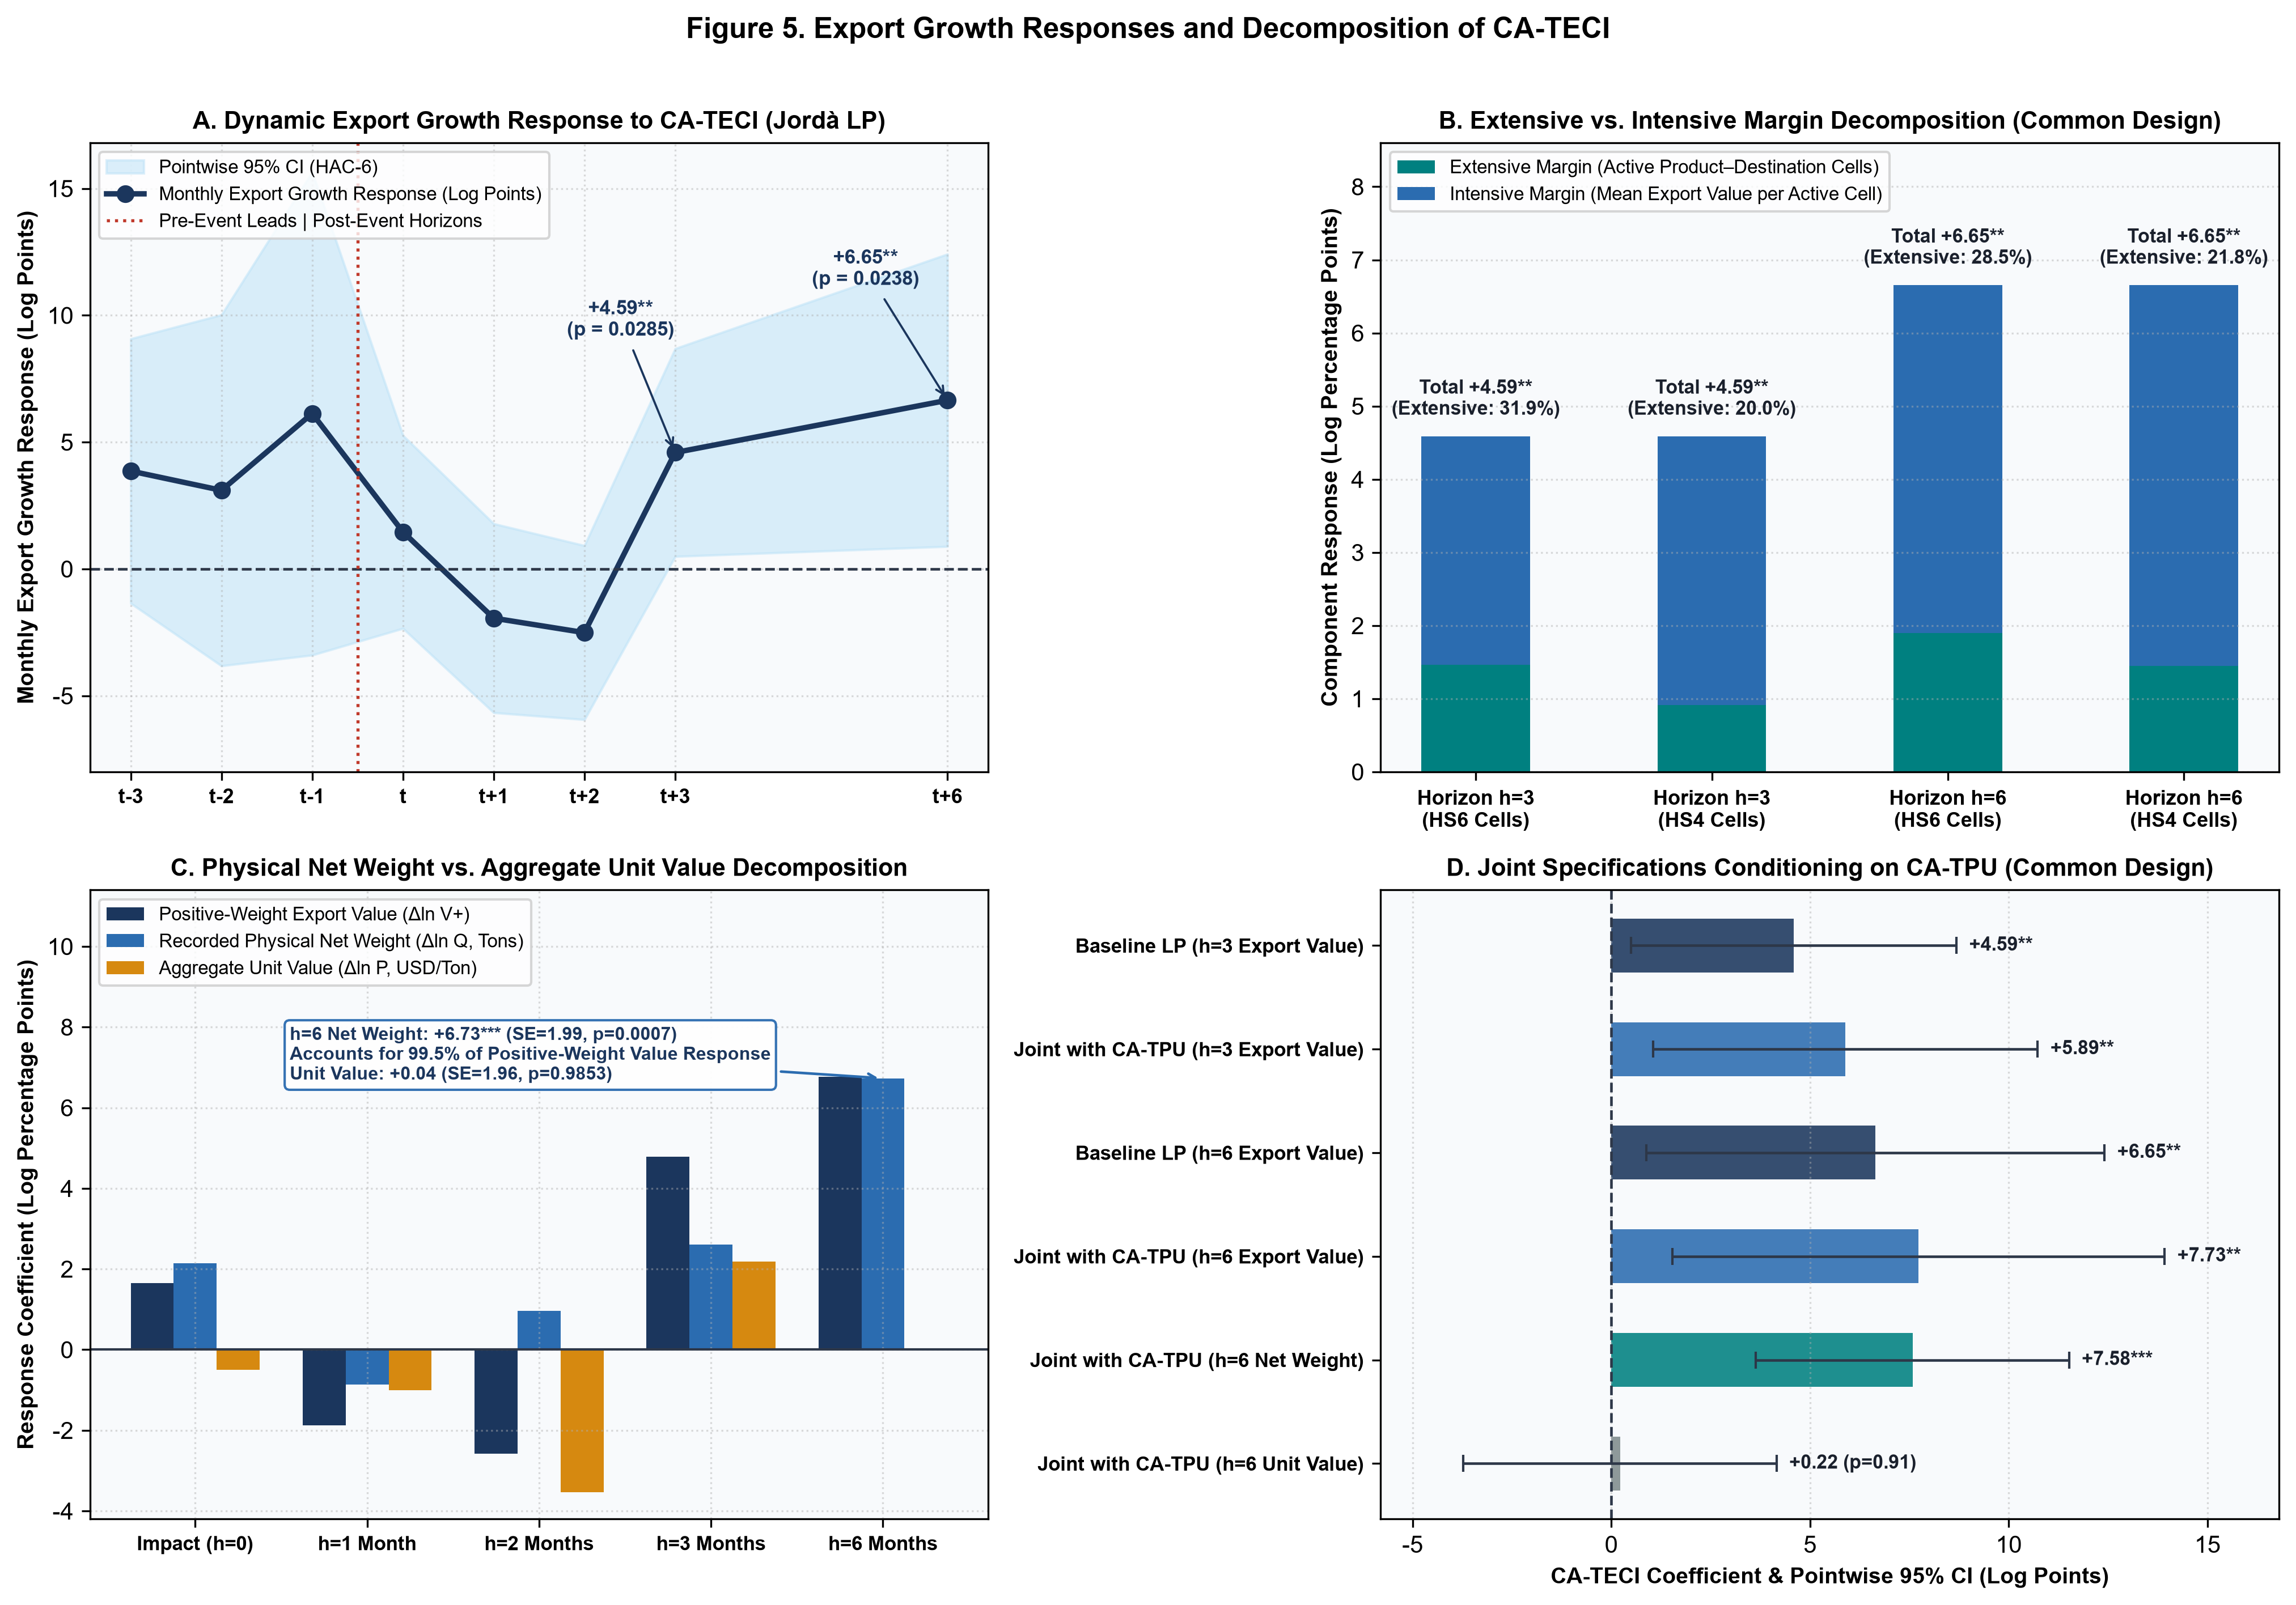
A one-standard-deviation increase in CA-TECI is associated with a cumulative export increase of 16.6% at six months, controlling for exchange rates, commodity prices, destination industrial output and seasonality.
Market entry and the extensive margin
h = 3 · intensive margin: 36.3%
New product–destination relationships account for most early export growth, consistent with lower fixed compliance costs through agreements and trade facilitation.
Physical shipment growth
h = 3 · 94.0% at h = 6
Decomposing export value into net weight and unit value attributes most expansion to greater shipment volumes, supporting cross-border goods flows as a channel linking cooperation to trade.
4. Export responses and margins of trade
Local projections (Jordà, 2005) use 160,722 observations at the eight-digit product, destination and month level. A one-standard-deviation increase in CA-TECI is associated with a cumulative export increase of 16.6% at six months (; ). At three months (), new product–destination relationships account for 63.7% of export growth, while expansion within existing relationships accounts for 36.3%. Physical shipment growth contributes 99.5% of the increase in export value at three months and 94.0% at six months. These estimates support market entry and greater shipment volumes as channels linking cooperation to trade.
5. Index properties and empirical results
Country series: research figure