一、制度性经贸合作的文本测度
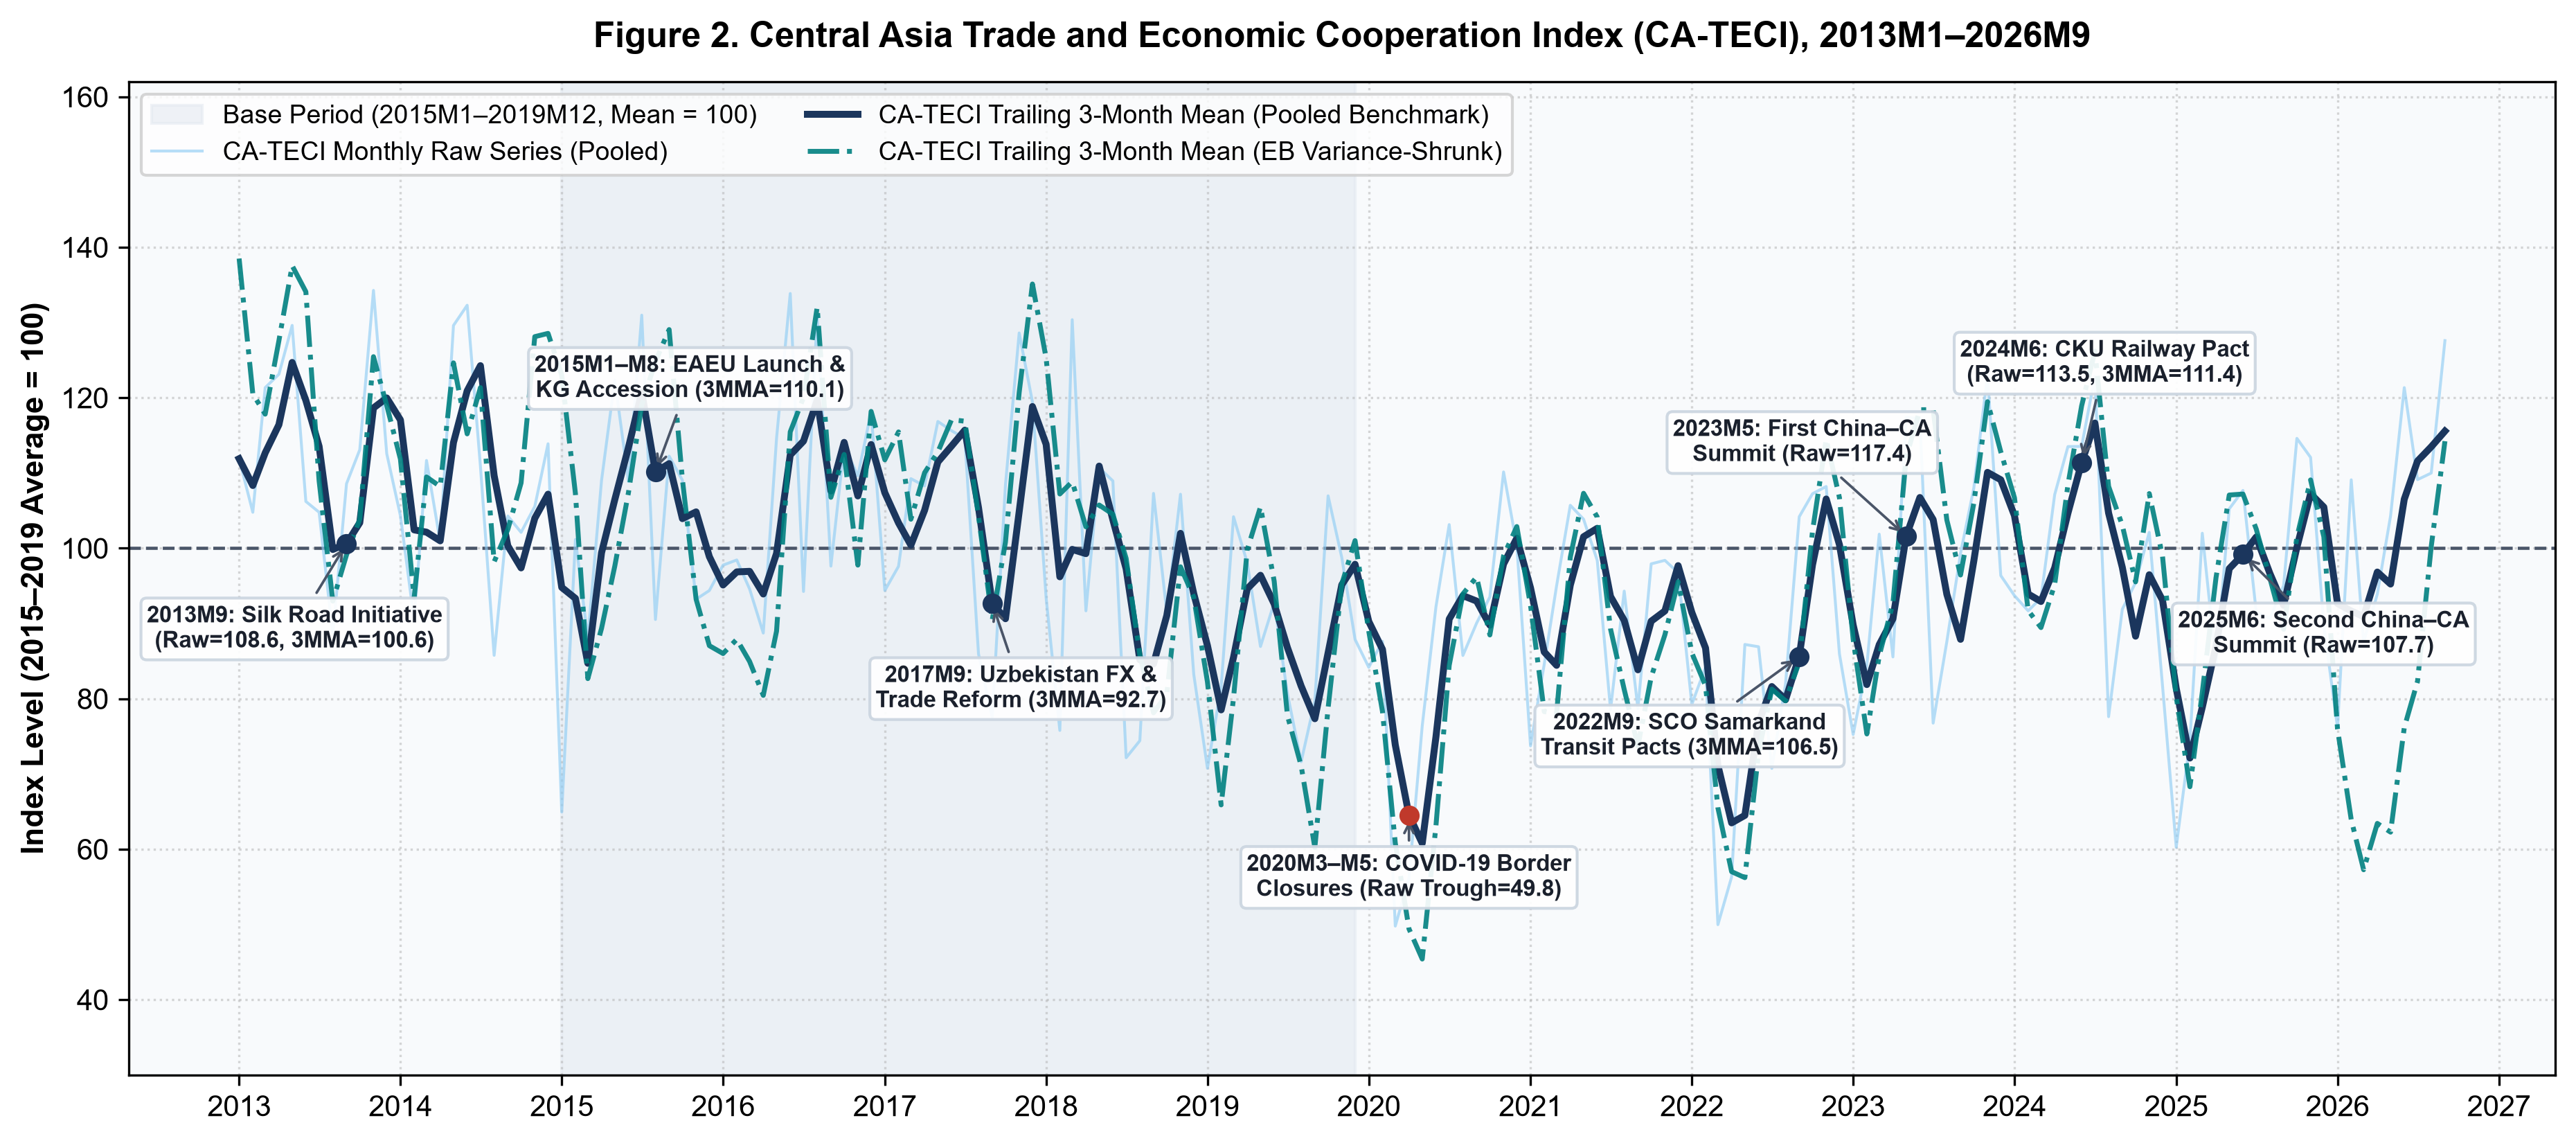
贸易政策不确定性与制度性经贸合作是影响跨境交易的两类政策因素。参照Baker、Bloom与Davis(2016)的文本测度方法,CA-TECI将合作行为纳入量化分析,识别贸易协定、关税互惠、通关便利化与跨境基础设施合作的新闻报道。这一指标用于研究中亚经贸合作的时间变化及其与贸易流量的关系。
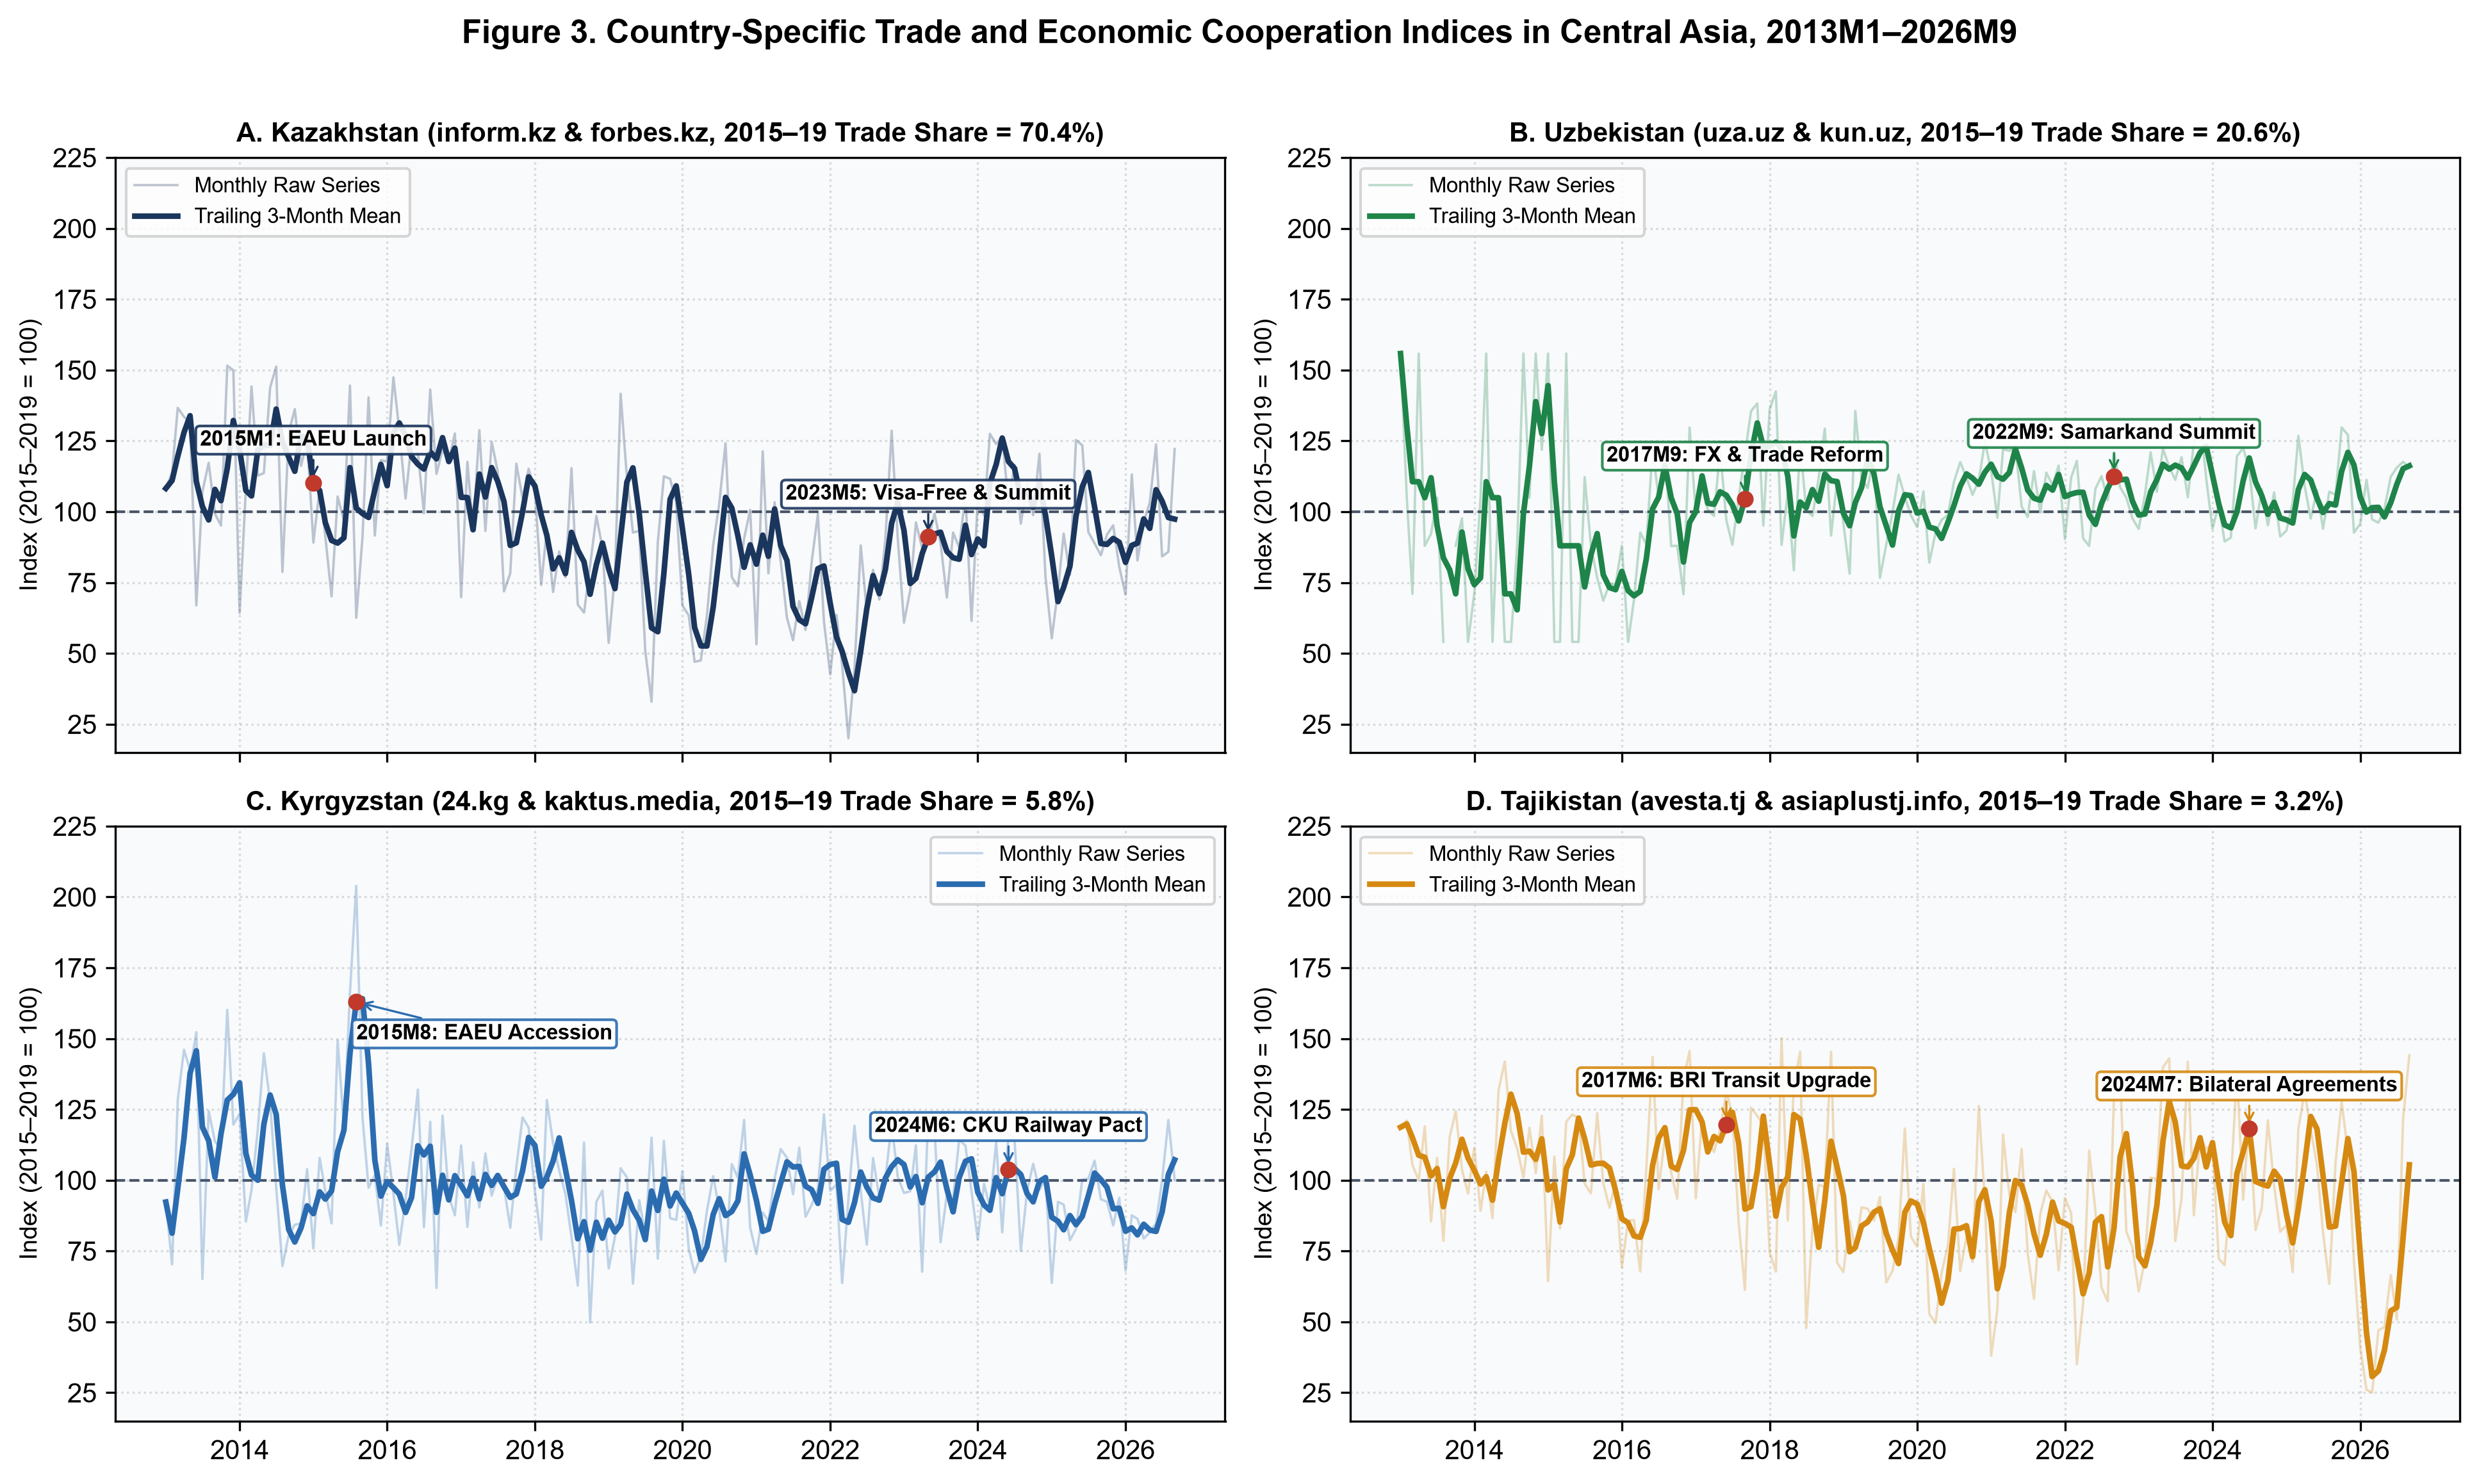
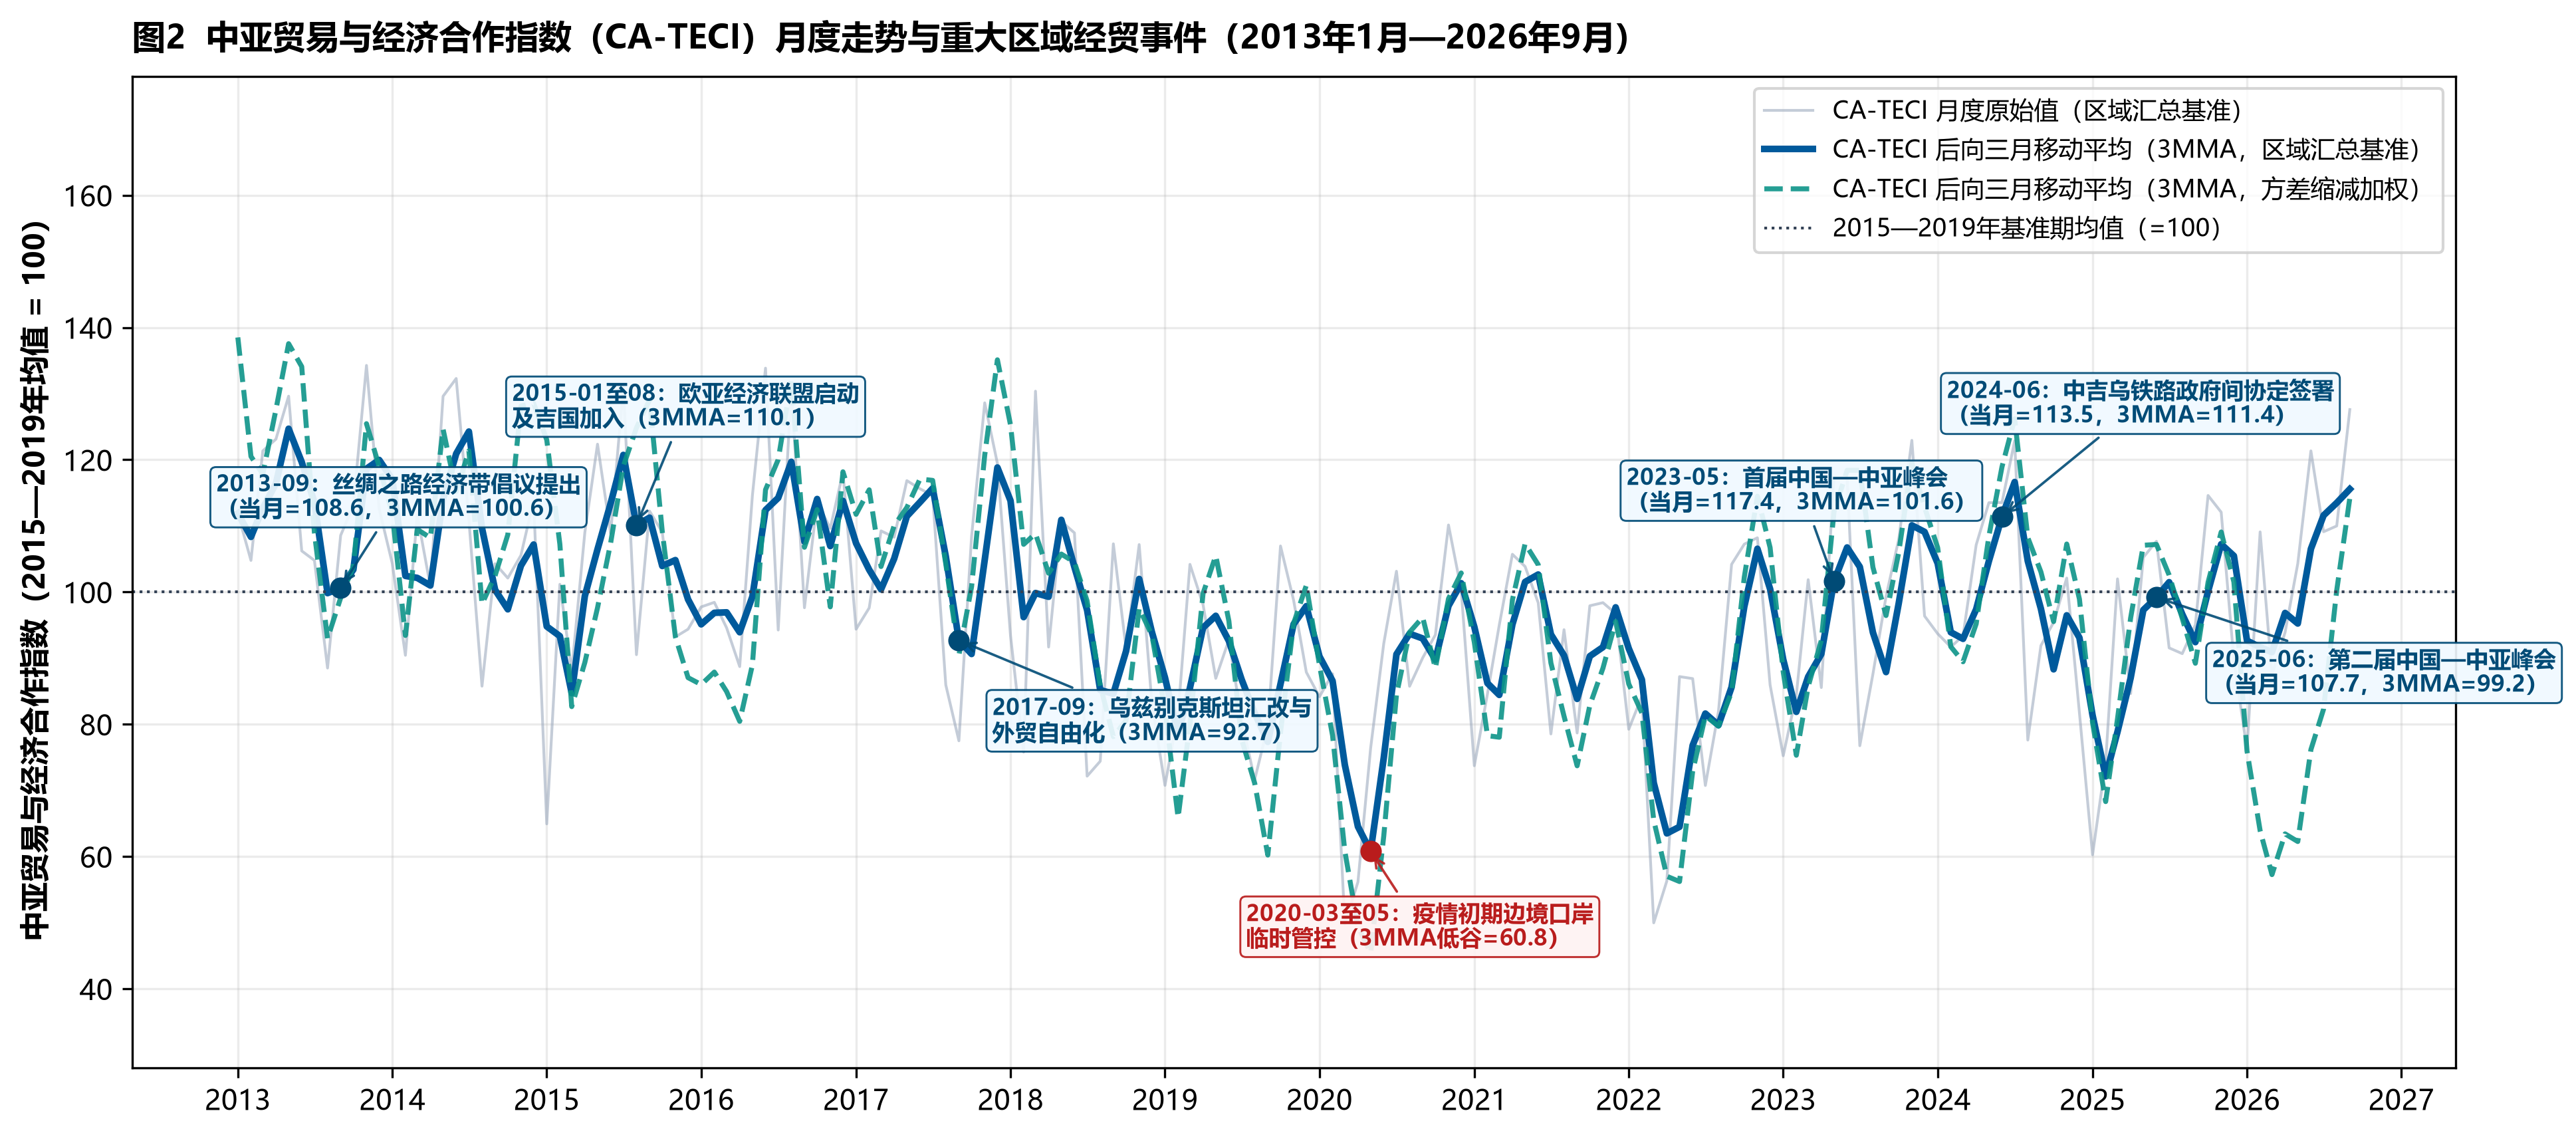
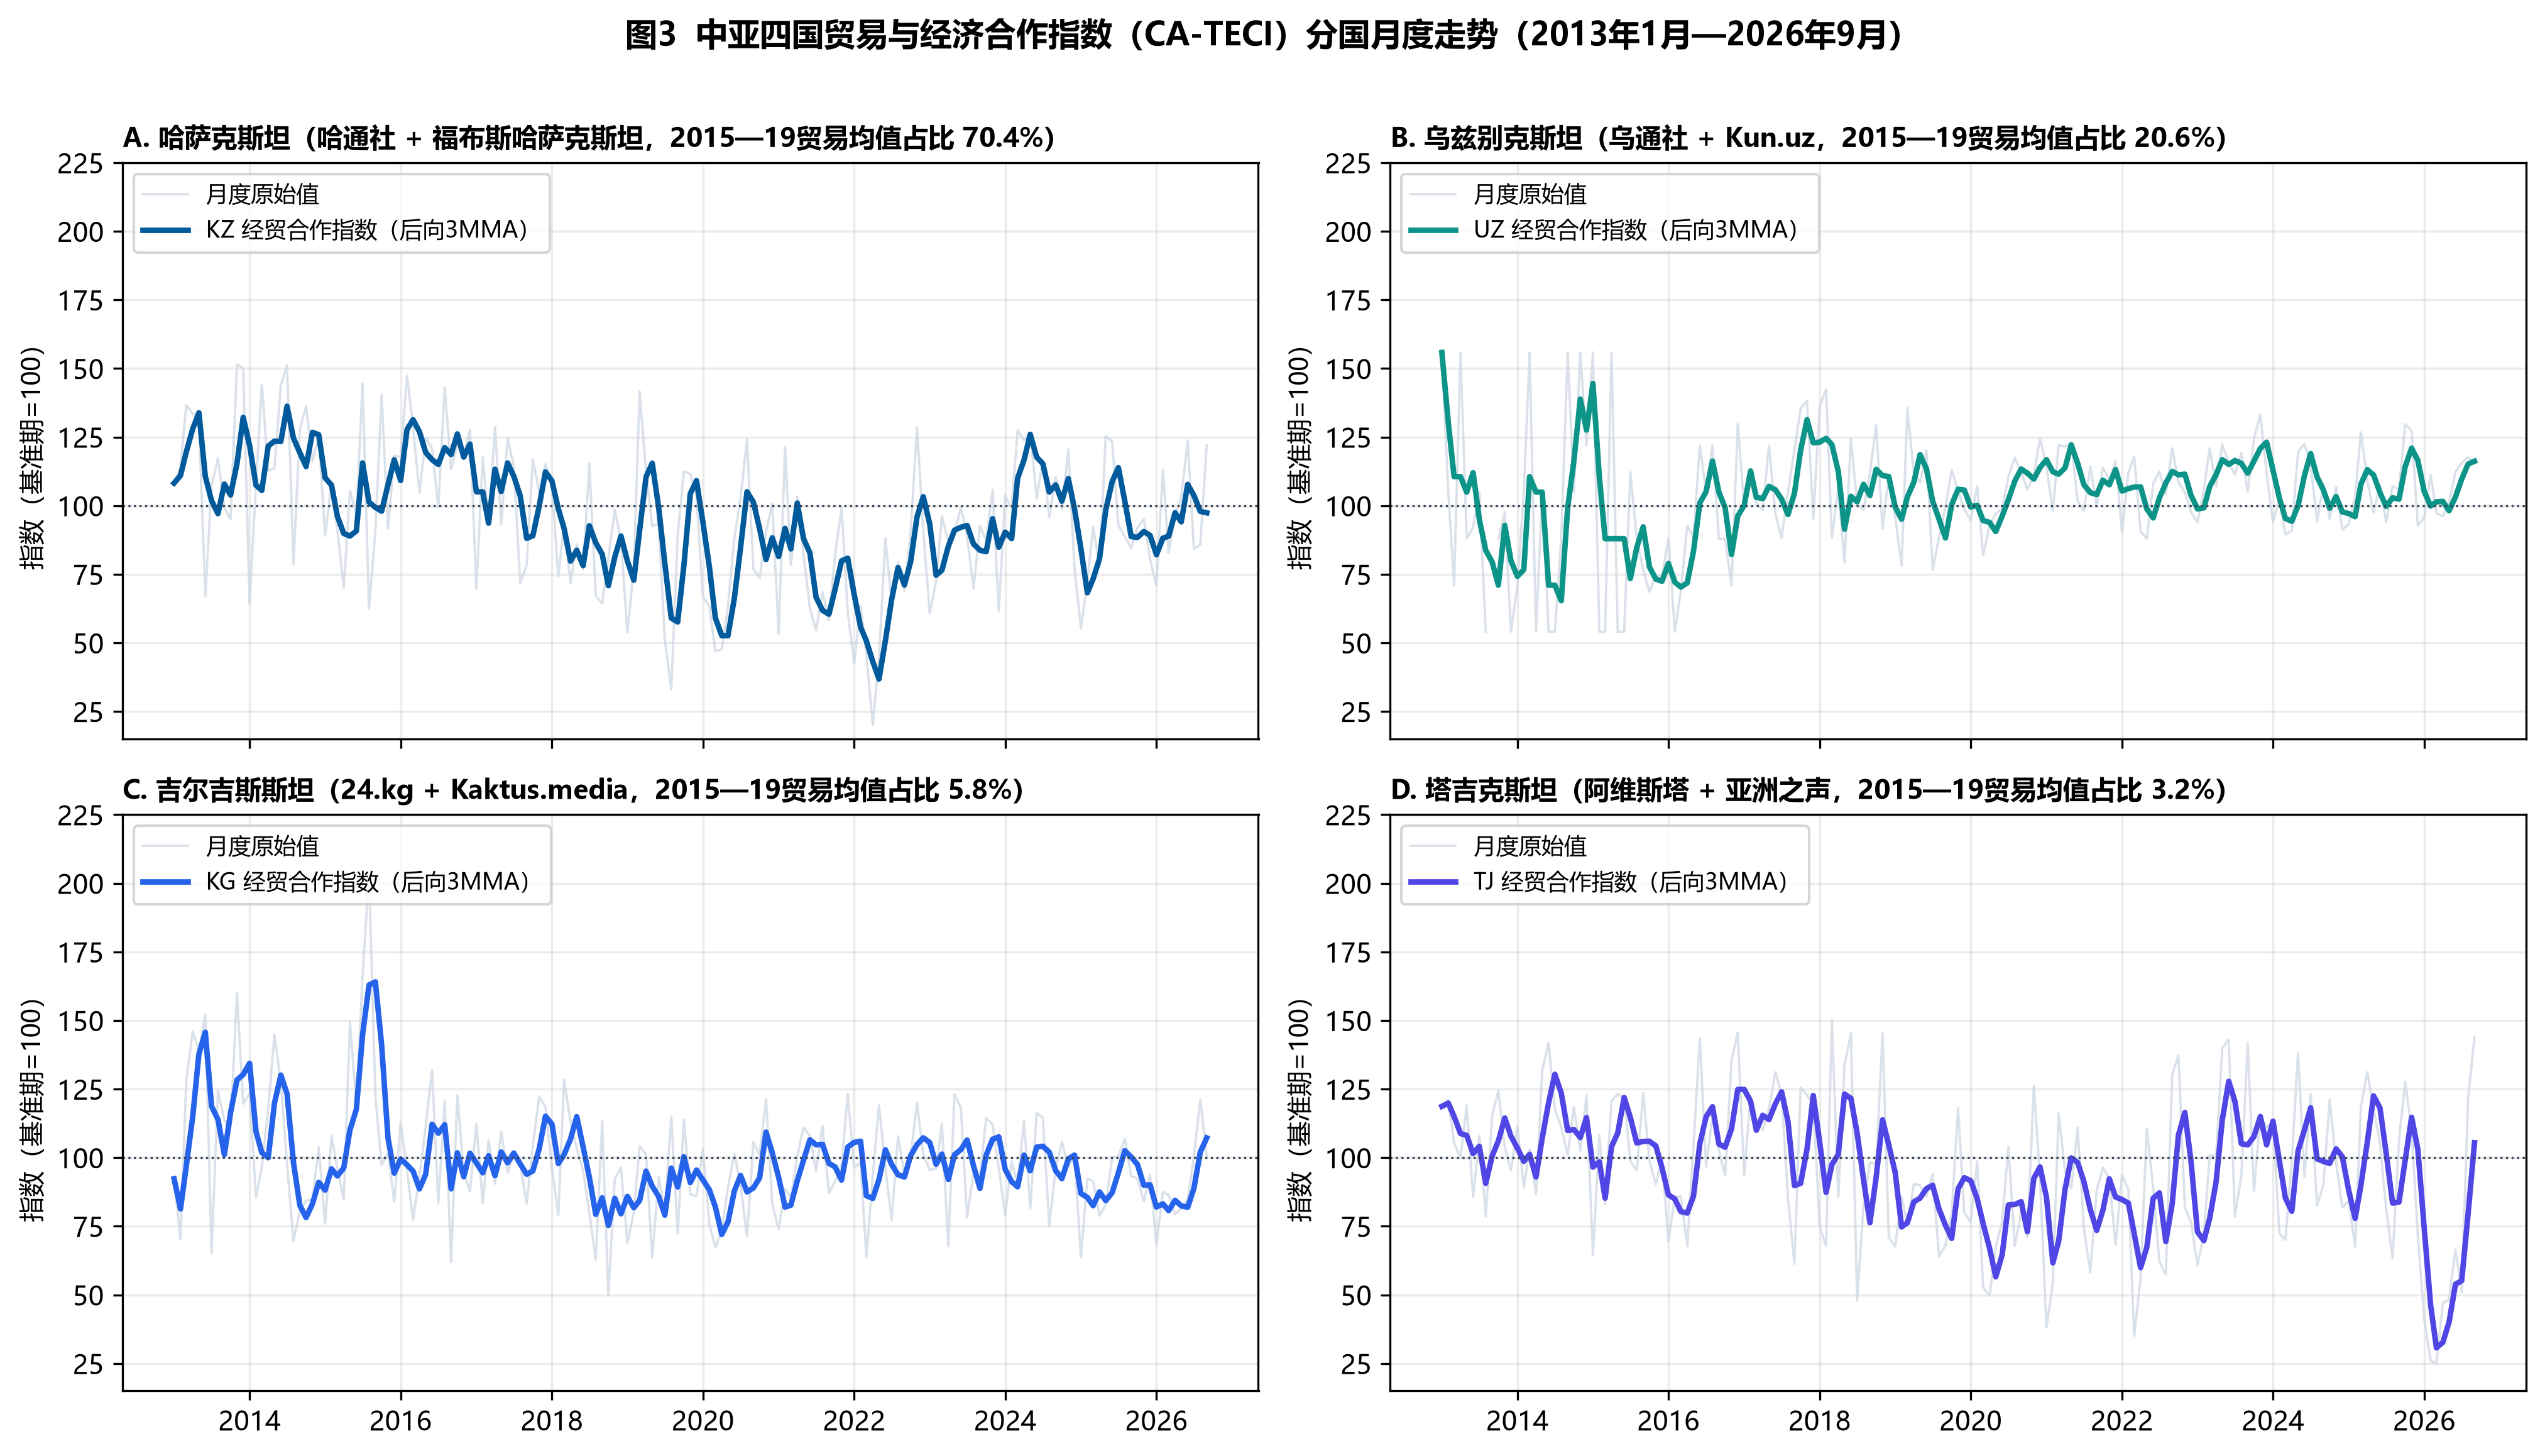
新疆大学经济与管理学院张立杰教授团队使用与CA-TPU相同的新闻样本,编制中亚贸易与经济合作指数(CA-TECI)。样本覆盖中亚四国八家俄语媒体,包含2013年1月至2026年9月的3,084,775篇报道。两项指数采用统一基期,测度政策不确定性与制度性合作两个维度。
二、新闻样本与涉外经贸政策报道
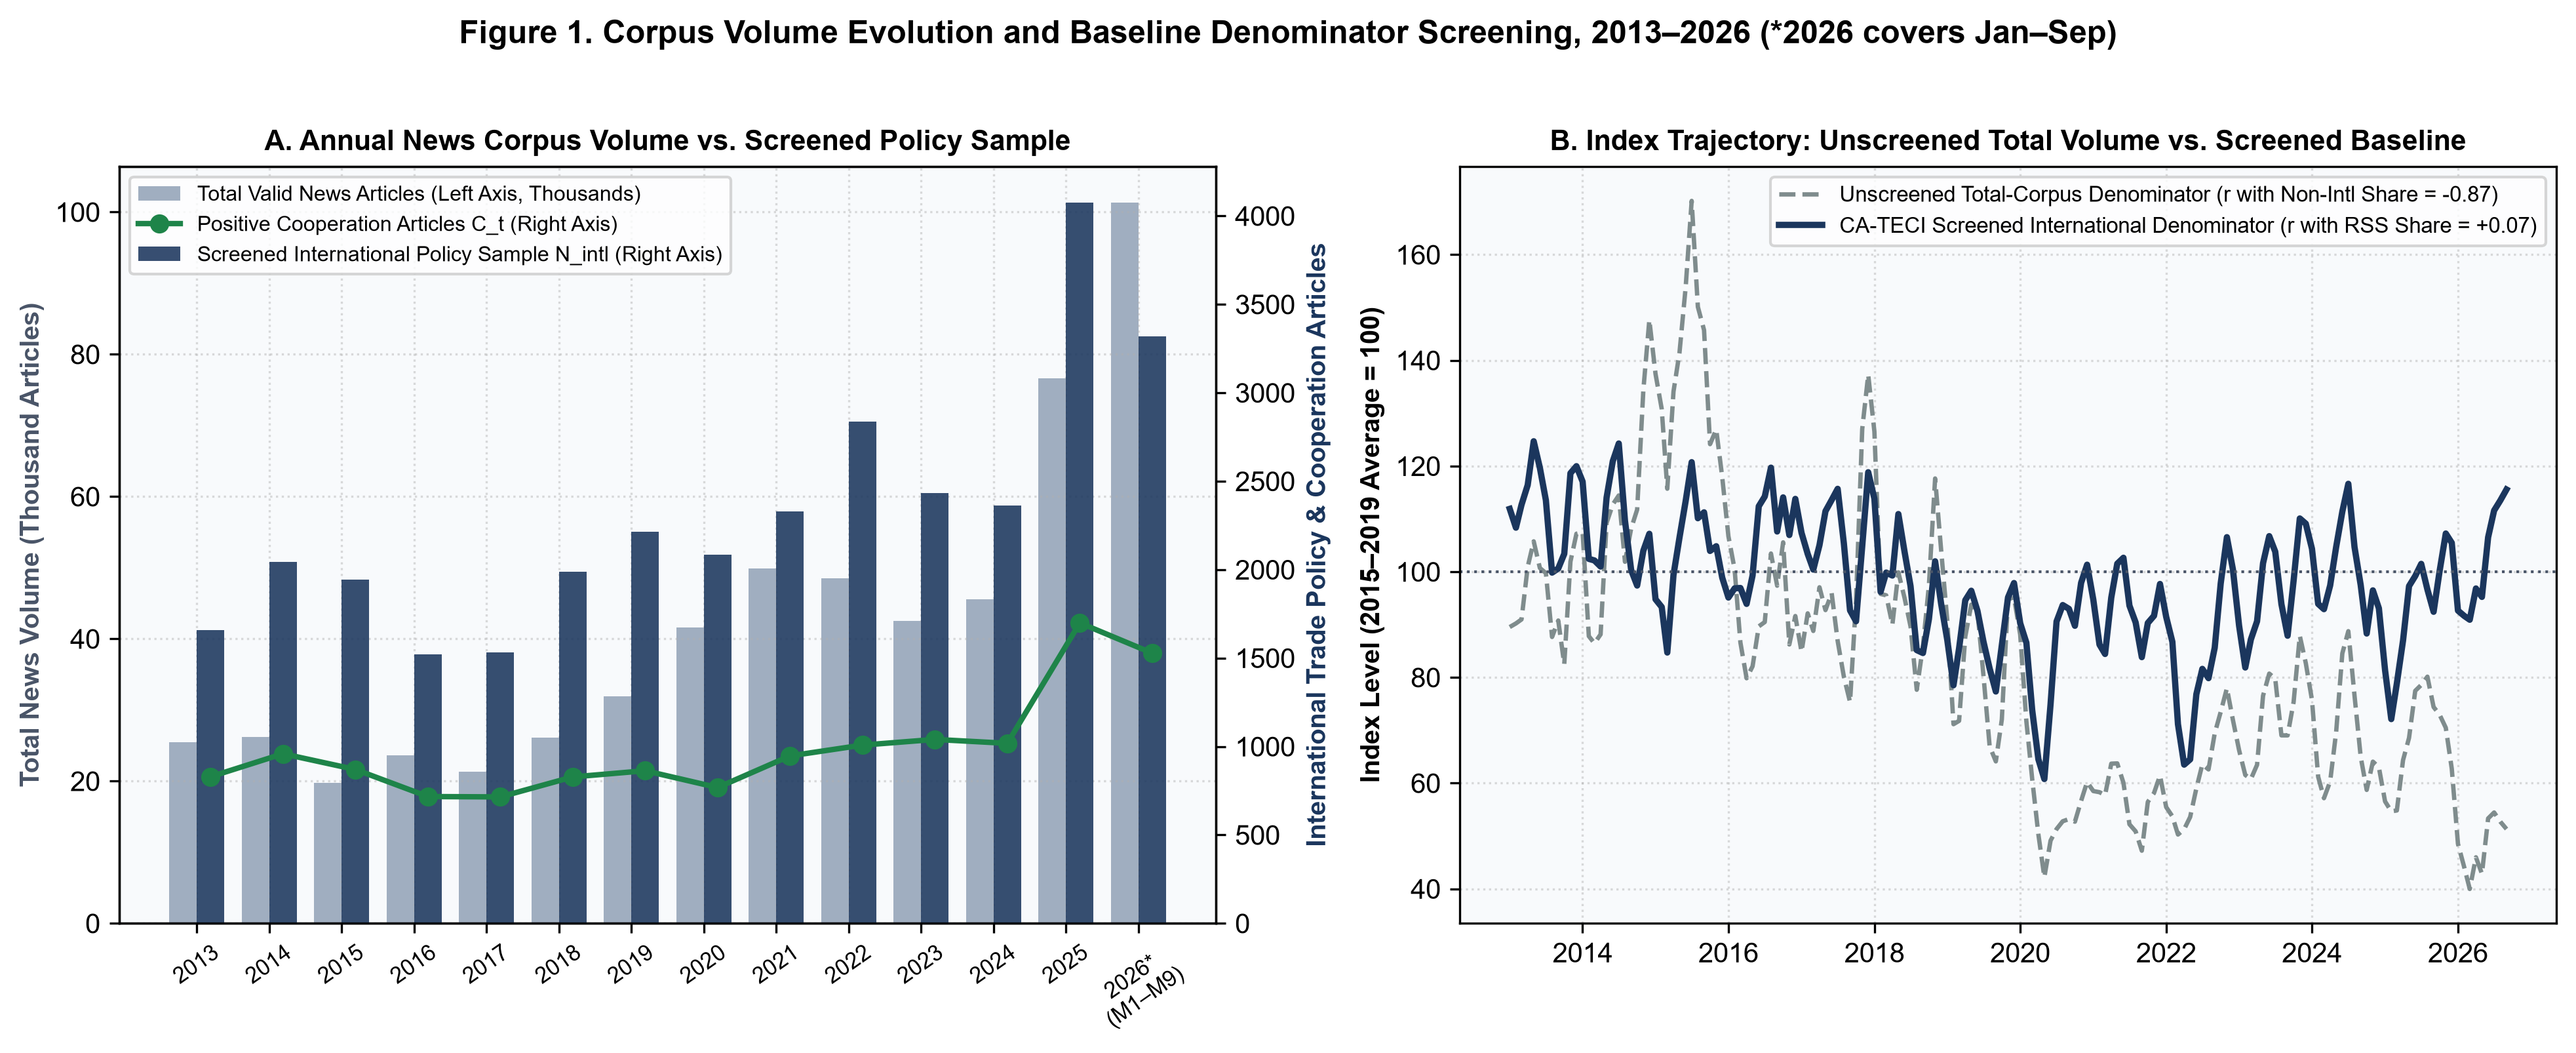
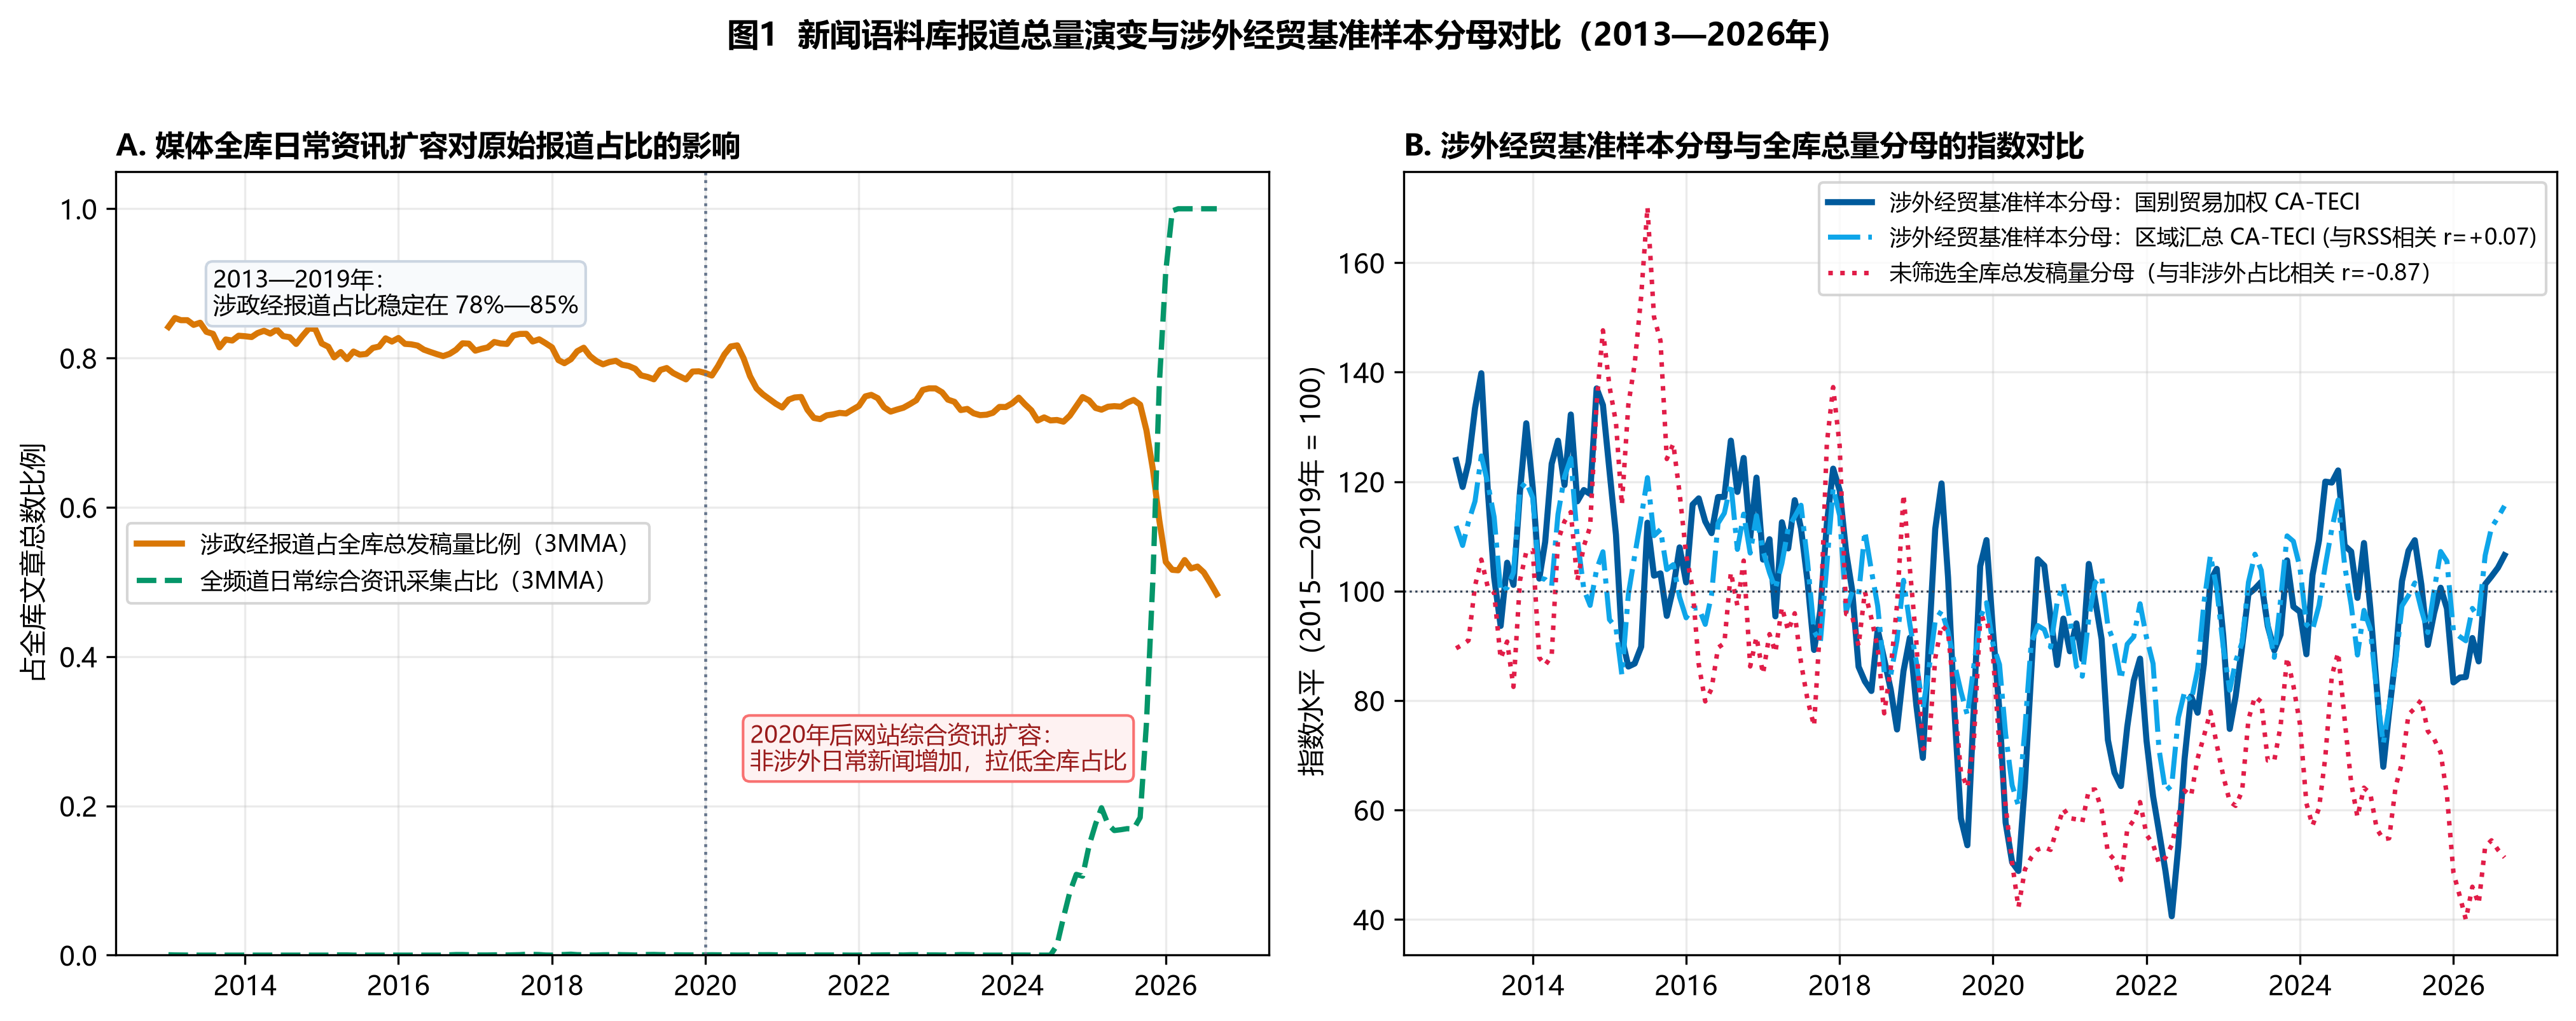
CA-TECI以涉外经贸政策报道为基准样本,降低社会与娱乐类报道扩张对分母构成的影响。排除供电、供暖、供水和市内客运等国内公用事业费率报道后,基准样本 共32,340篇。其中,同时符合贸易、政策与合作关键词条件,且不含单边制裁或禁令等限制性词汇的合作报道 共6,591篇,占20.38%。
| 国家 | 新闻媒体 | 新闻样本总数 | 涉外经贸政策样本 () | 经贸合作报道 () | 基期合作占比均值 (%) | 基期占比标准差(百分点) | 经验贝叶斯权重 () |
|---|---|---|---|---|---|---|---|
| 哈萨克斯坦 (KZ) | Kazinform (国际通讯社) | 800,664 | 9,472 | 2,299 | 20.47 | 4.68 | 11.21% |
| Forbes Kazakhstan | 147,518 | 3,489 | 496 | 13.06 | 3.78 | 15.29% | |
| 乌兹别克斯坦 (UZ) | Kun | 295,041 | 3,701 | 594 | 14.54 | 5.42 | 9.43% |
| UzA (国家通讯社) | 166,464 | 2,824 | 1,013 | 30.29 | 5.12 | 10.25% | |
| 吉尔吉斯斯坦 (KG) | 24通讯社 | 386,704 | 4,209 | 555 | 13.38 | 4.01 | 13.45% |
| Kaktus Media | 1,090,618 | 3,795 | 428 | 11.15 | 4.34 | 12.22% | |
| 塔吉克斯坦 (TJ) | Asia-Plus | 114,578 | 2,850 | 580 | 19.86 | 3.93 | 13.87% |
| Avesta | 83,188 | 2,000 | 626 | 30.69 | 3.81 | 14.28% | |
| 区域合计与汇总统计 | 3,084,775 | 32,340 | 6,591 | 17.85 | 3.23 | 100.00% | |
三、人工标注验证与媒体样本稳健性
研究团队通过分层抽样人工标注检验文本分类准确性。样本包含600篇俄语报道,其中主分层样本450篇,包含贸易摩擦或公用事业词汇的补充复核样本150篇。两名具备俄语经贸文献阅读能力的研究人员独立开展双盲标注,并采用Horvitz–Thompson逆概率加权估计分类性能。
| 评估指标 | 主分层样本 () | 含补充复核的全样本 () | 95% 置信区间 |
|---|---|---|---|
| 逆概率加权精确率 (Precision) | 87.2% | 86.7% | [82.8%, 90.6%] |
| 逆概率加权召回率 (Recall) | 86.5% | 86.2% | [81.9%, 90.5%] |
| 分数 | 86.8% | 86.5% | [83.1%, 89.9%] |
| 标注者间一致性系数 () | 0.856 | 0.851 | [0.812, 0.890] |
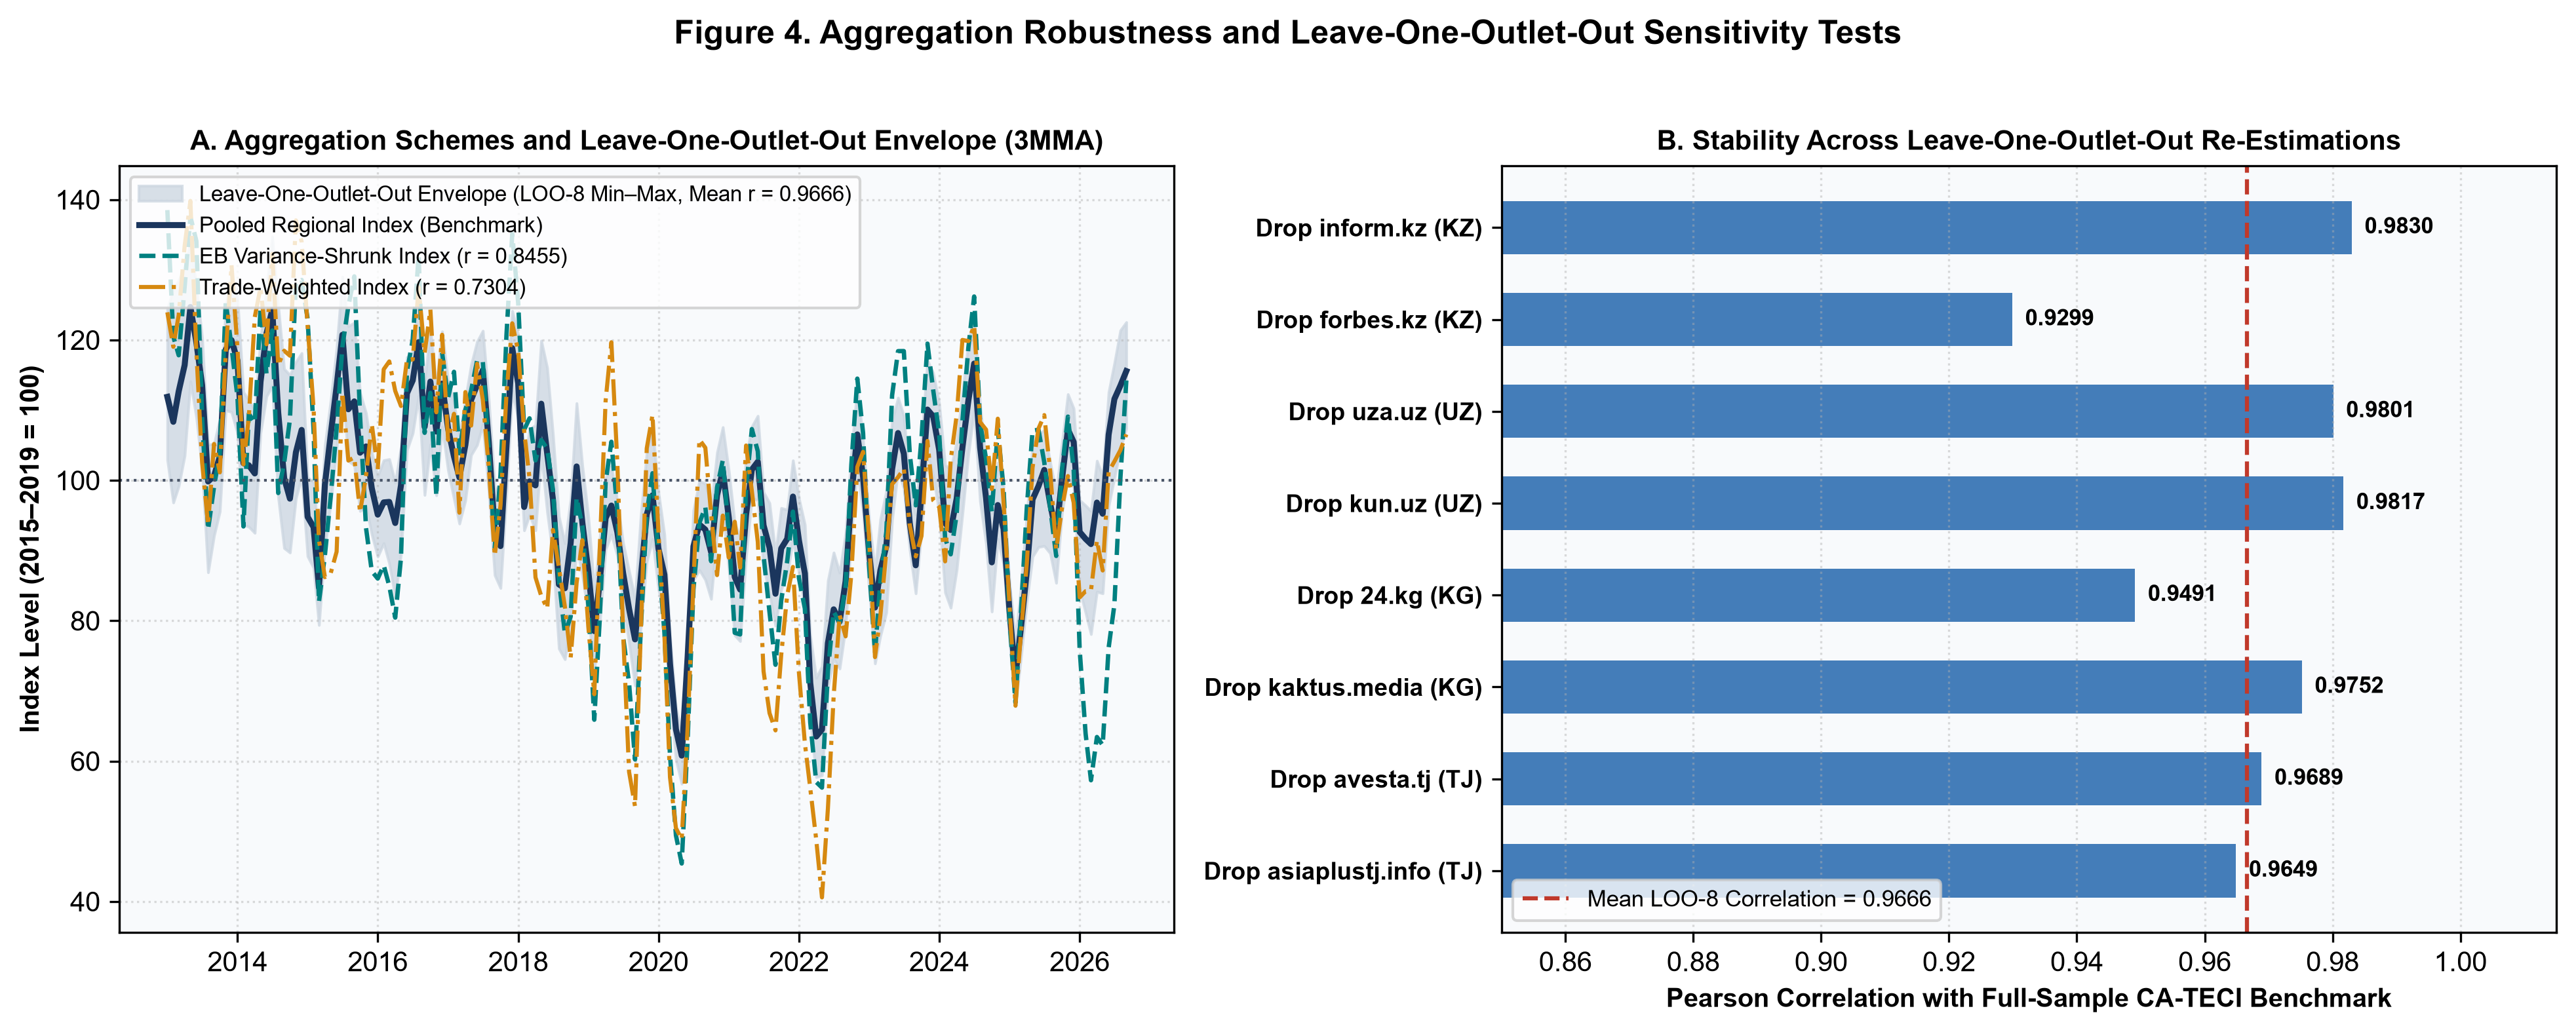
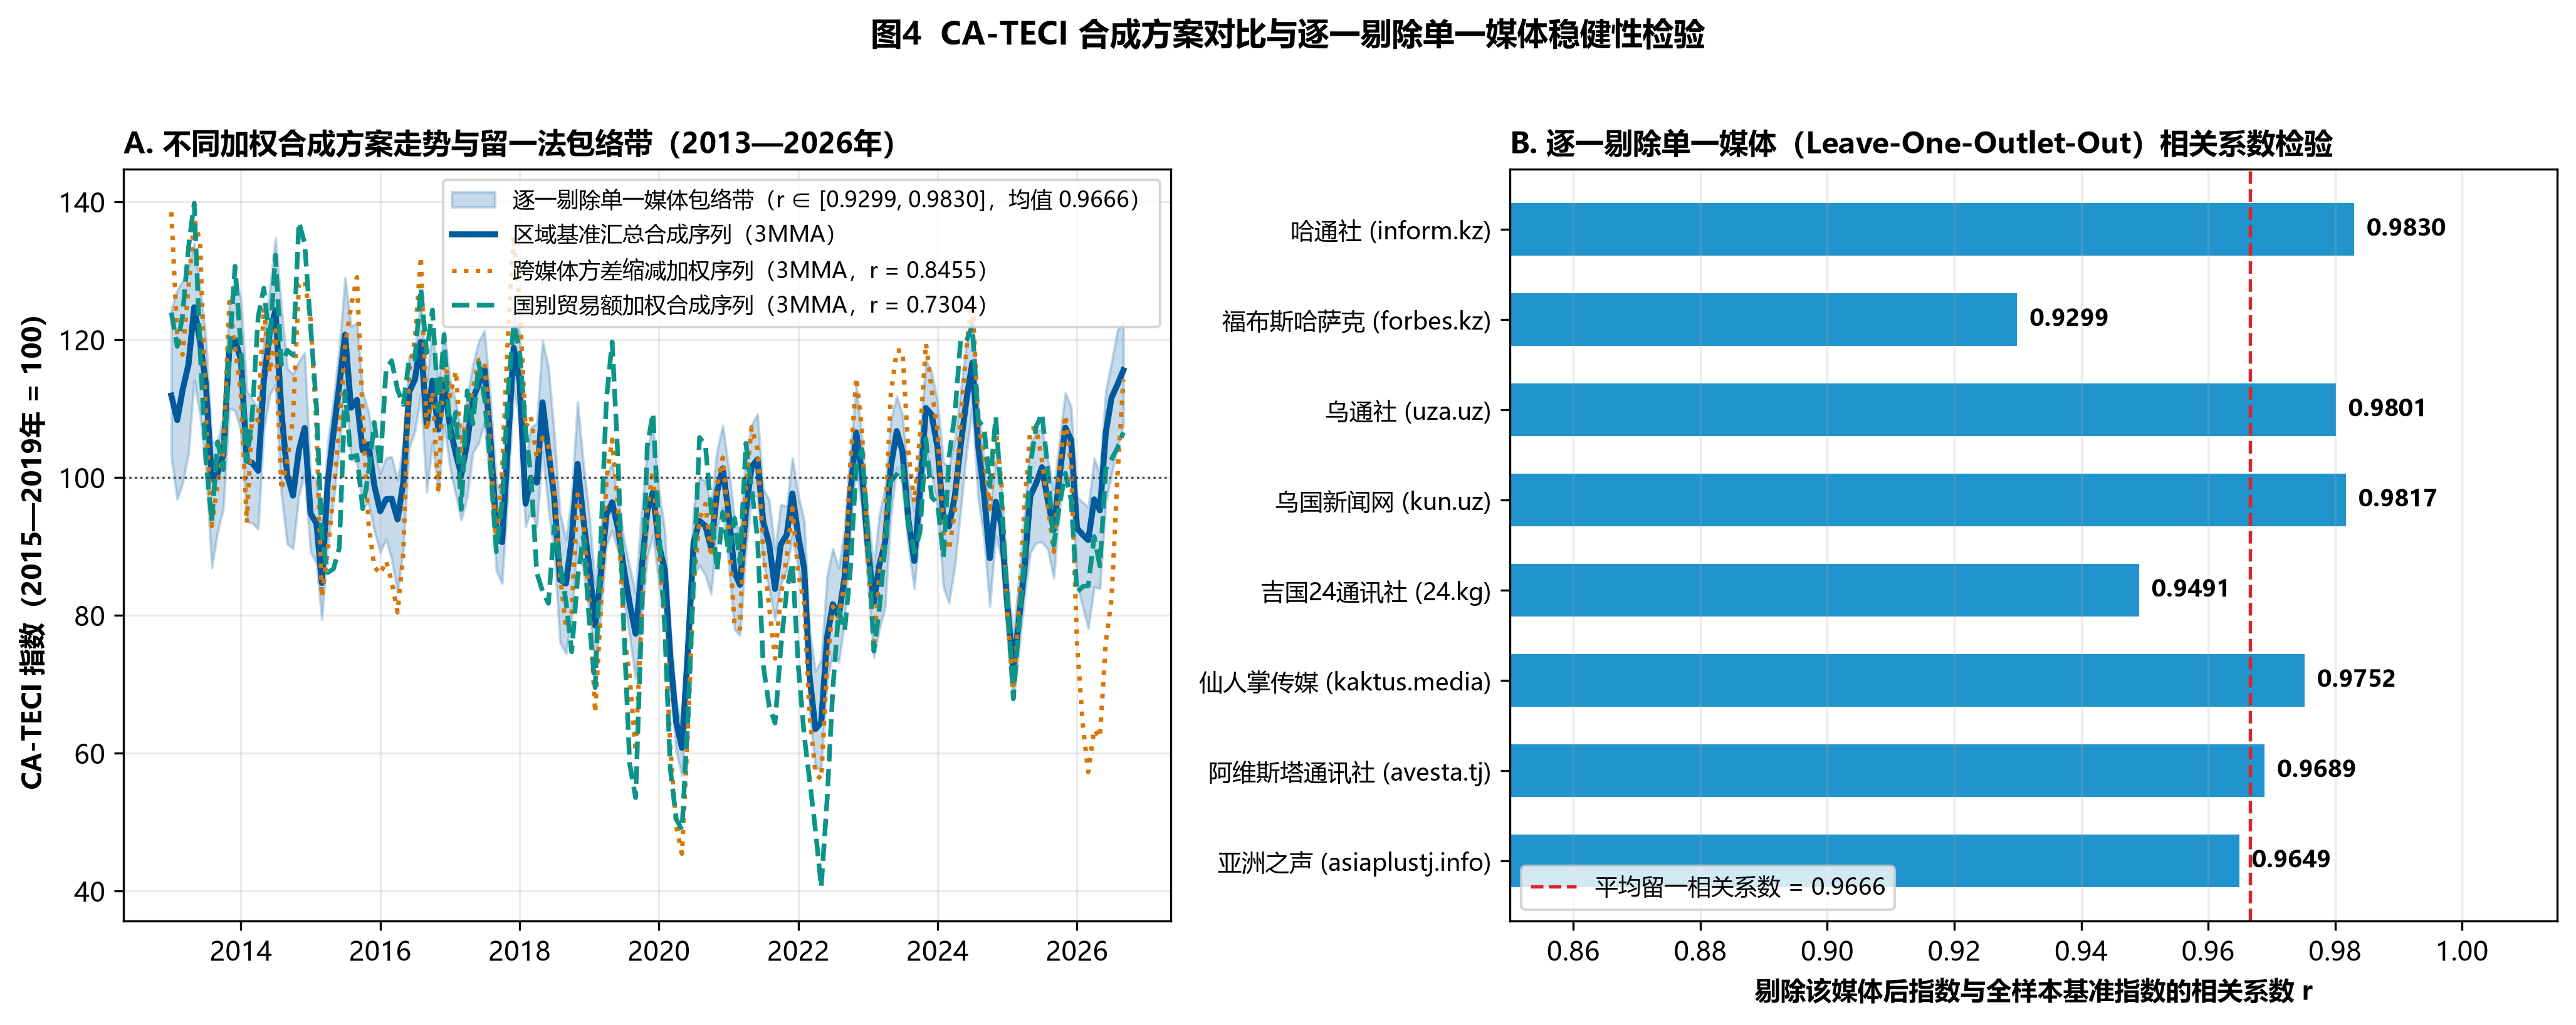
逐一剔除媒体的稳健性检验(Leave-One-Outlet-Out)显示,剔除任一家媒体后重新编制的区域指数与基准指数的相关系数介于0.9587和0.9969之间。区域汇总、经验贝叶斯收缩、外贸规模加权及国别等权四种合成序列的两两相关系数均高于0.878,其中经验贝叶斯收缩序列与国别等权序列的相关系数为0.9616。这些结果表明,指数的主要时间变化对媒体样本构成与合成权重的调整具有稳健性。
KEY ECONOMETRIC FINDINGS
关键计量发现
局部投影(Local Projections)揭示双指数与出口的动态关系:CA-TPU上升对应出口收缩,CA-TECI上升对应出口扩张。
制度性合作与出口扩张
h = 6 · p < 0.01
控制双边汇率、全球大宗商品价格、目的国工业产出及季节效应后,CA-TECI上升一个标准差对应未来第6个月的累计出口增幅为16.6%。
市场进入与广延边际
h = 3 · 集约边际贡献36.3%
第3个月的出口增长主要来自新增产品与目的国组合,与经贸协议和通关便利化降低固定合规成本的机制一致。
实物货运量驱动贸易增长
h = 3 · h = 6时为94.0%
将出口额分解为货运净重与单位价值后,出口扩张主要由实物货运量增加构成,支持制度性合作通过跨境货物流动影响贸易的解释。
四、出口动态响应与贸易扩张边际
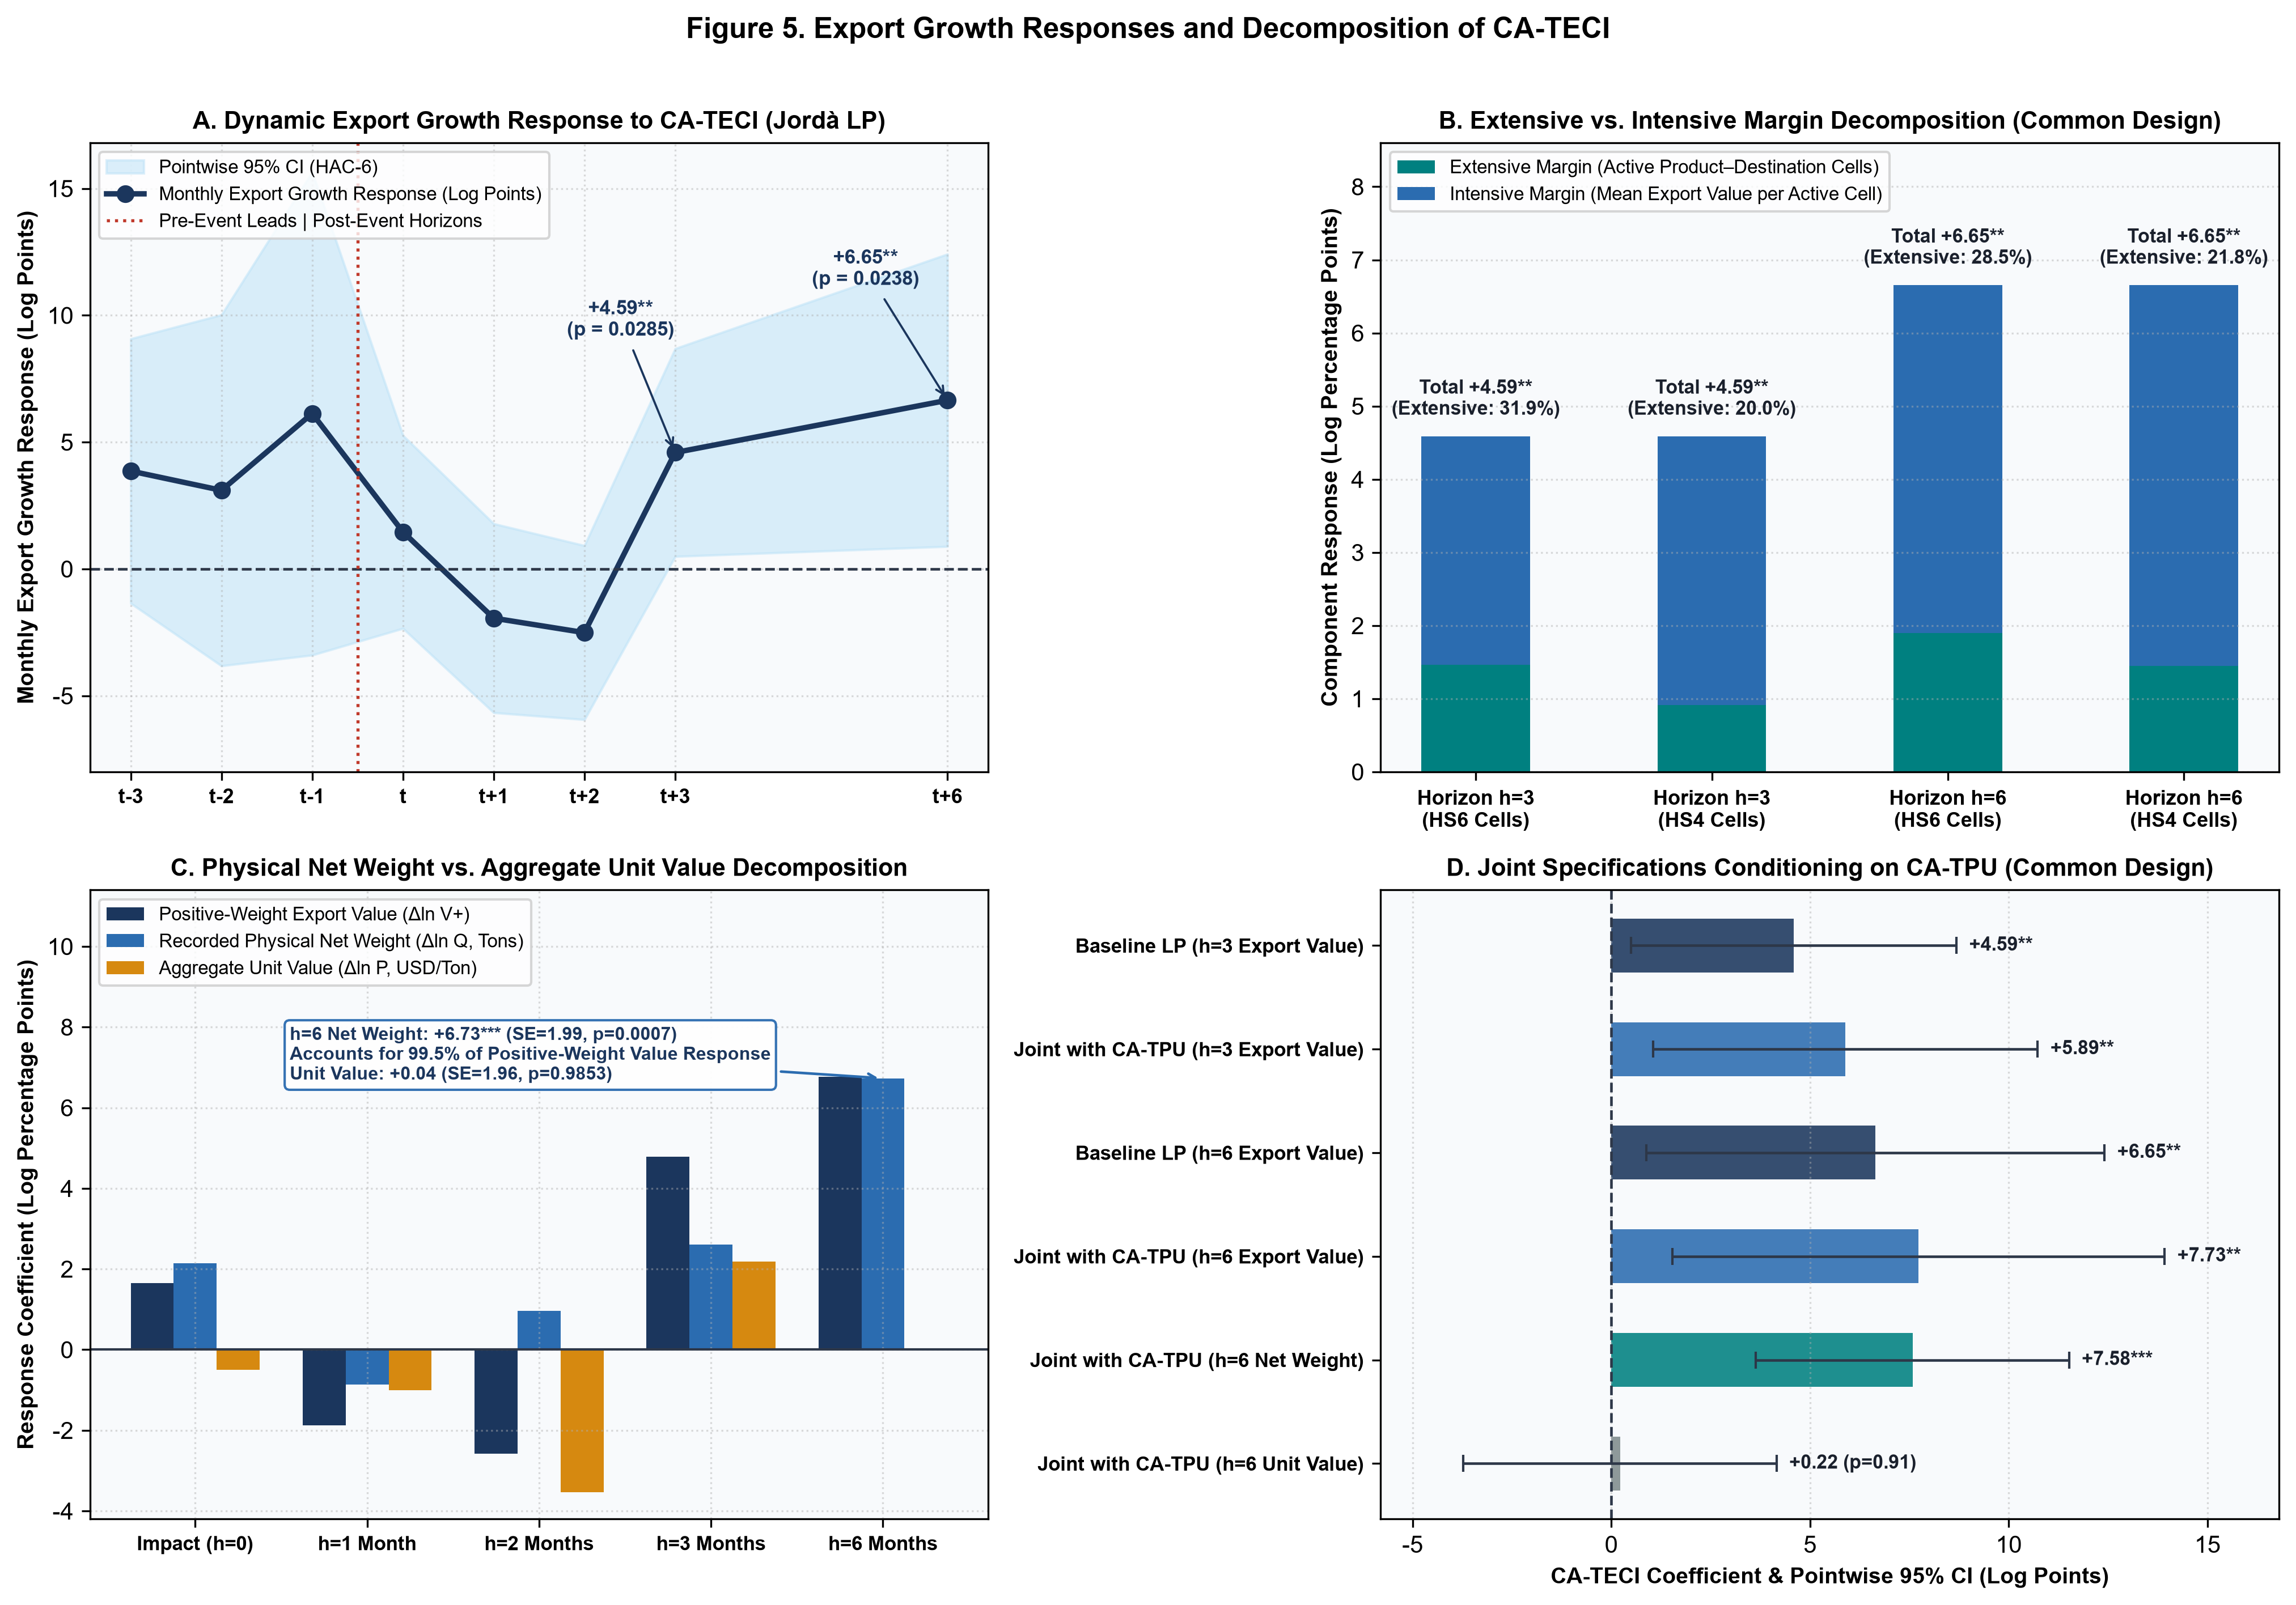
研究采用局部投影法(Jordà,2005),结合海关八位商品编码(HS-8)层面的160,722个产品、目的国与月份观测值,估计经贸合作指数与出口的动态关系。主要结果如下。
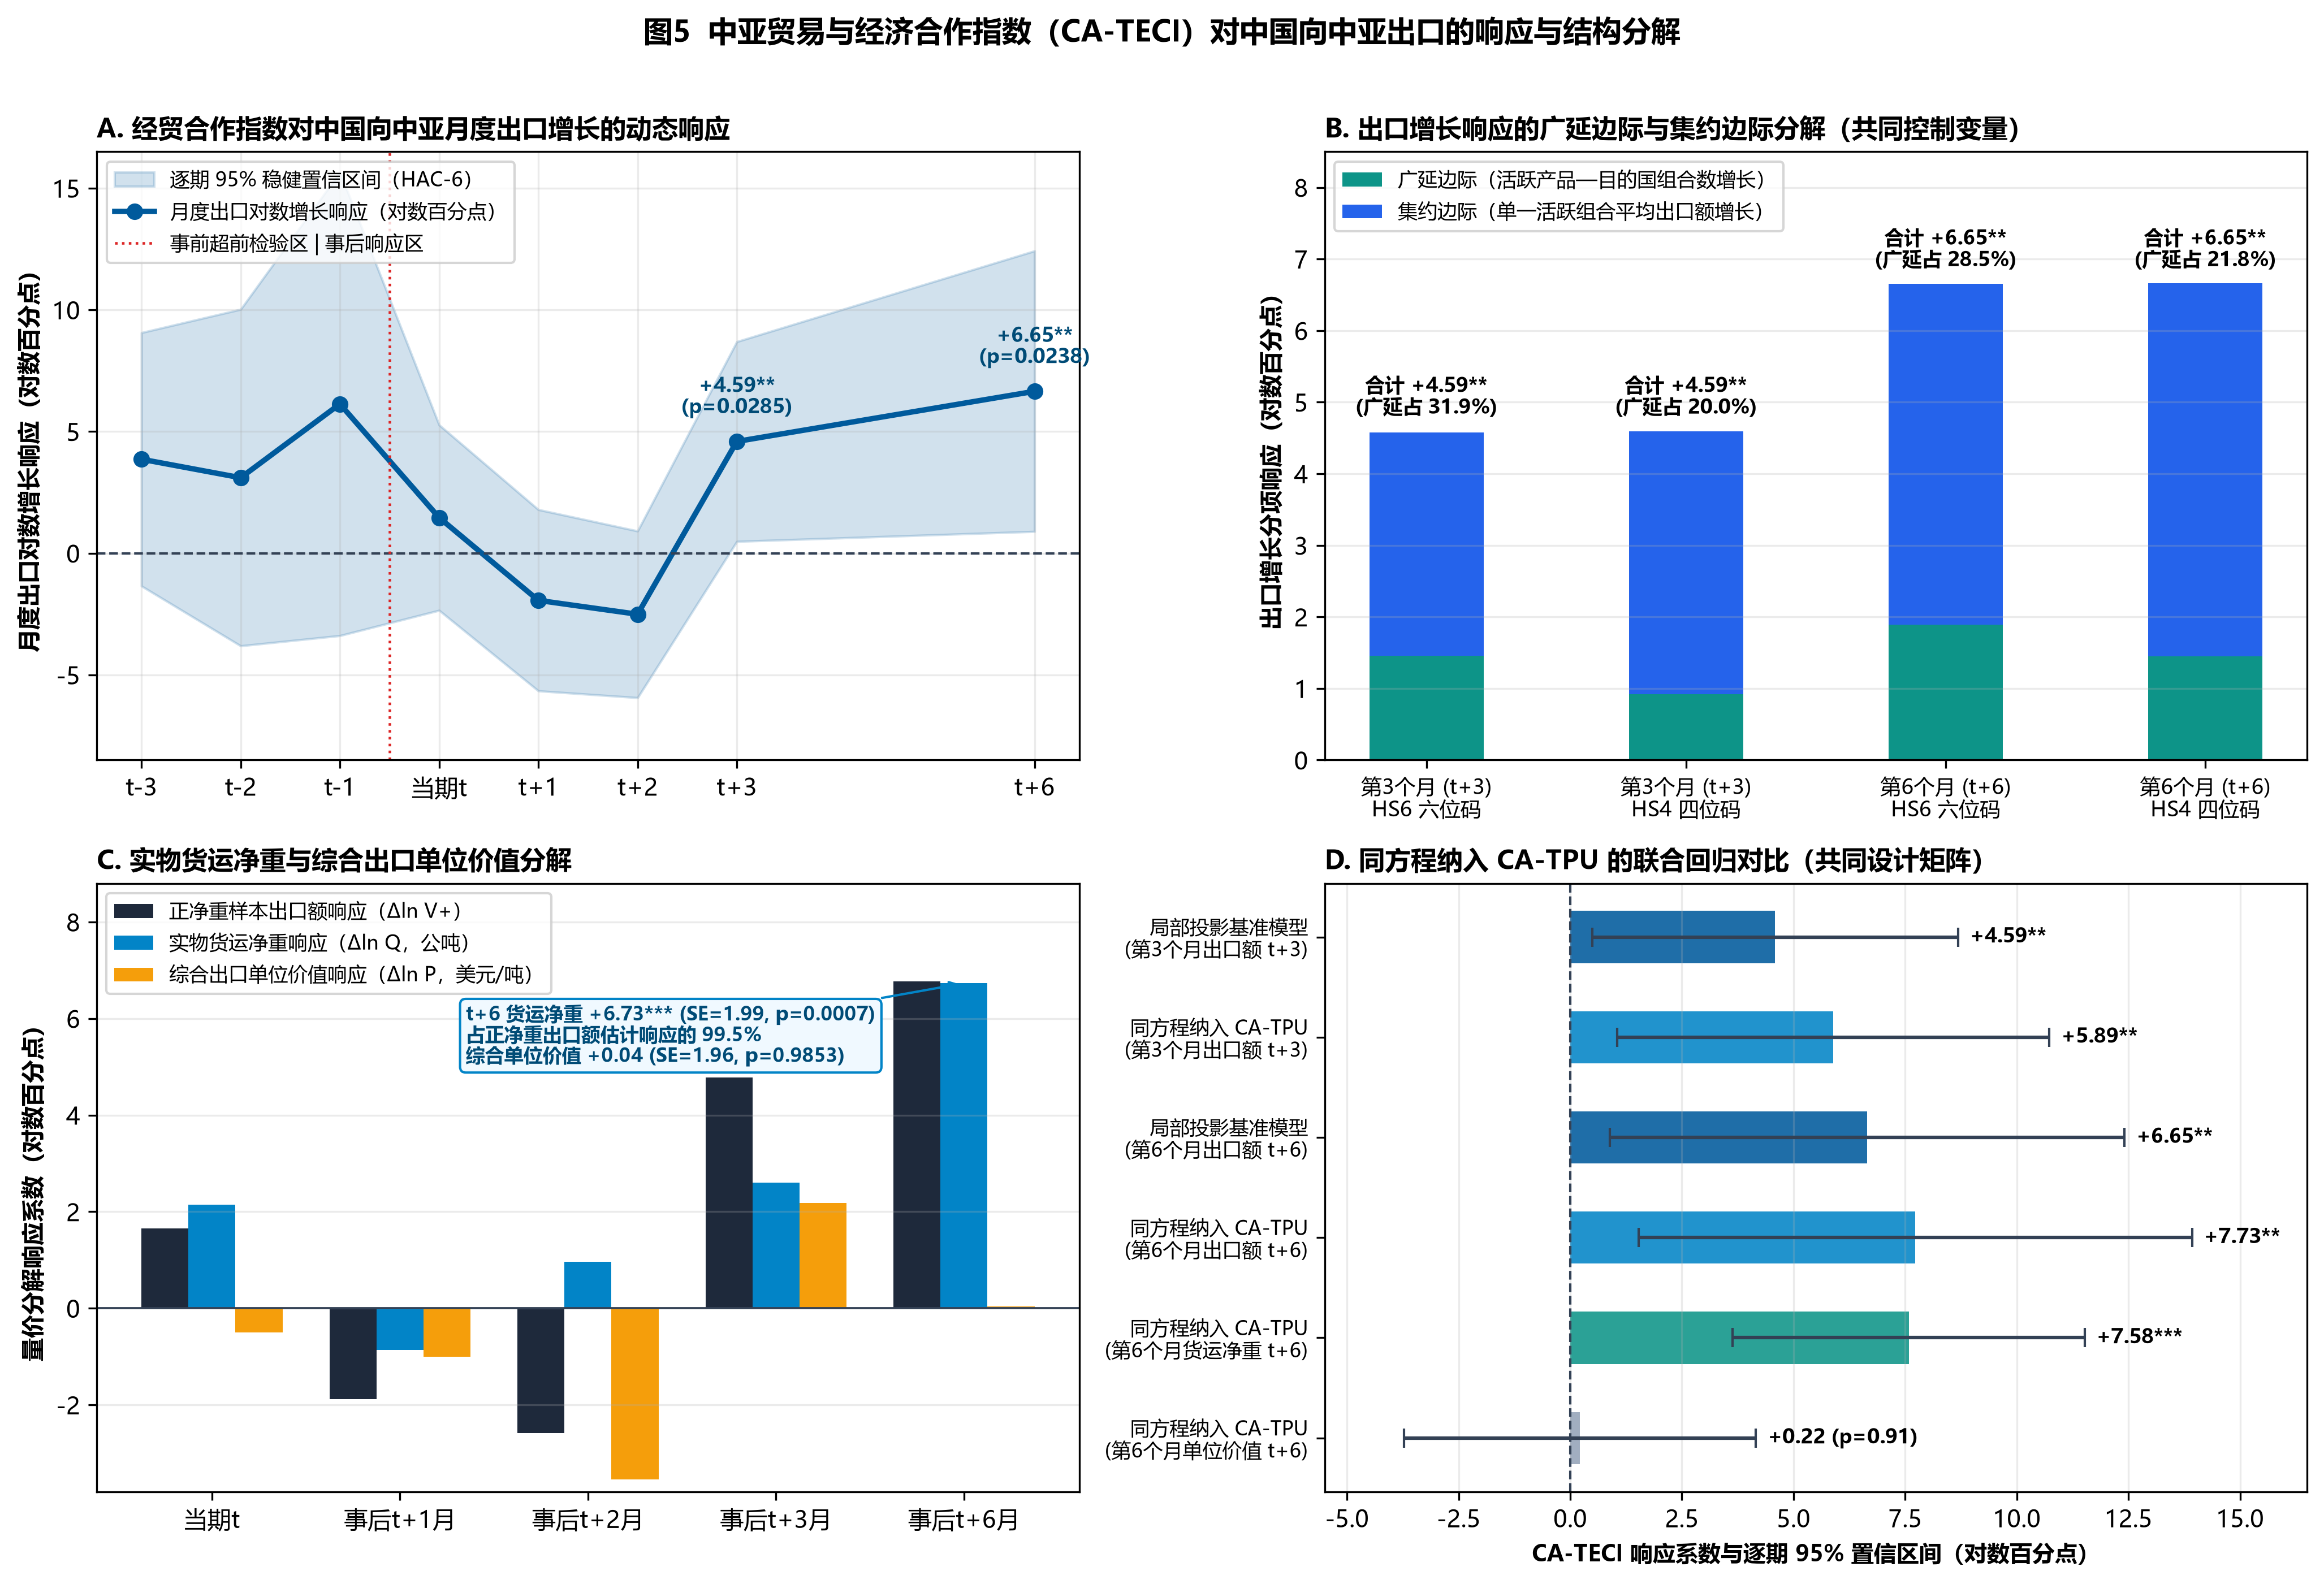
- 控制双边汇率、全球大宗商品价格、目的国工业产出及季节效应后,CA-TECI上升一个标准差对应未来3至12个月的出口显著扩张。第6个月()的累计出口增幅为16.6%()。CA-TPU上升对应显著的出口收缩,两项指数与贸易的动态关系方向相反。
- 第3个月()的出口增长中,63.7%来自新增产品与目的国组合所形成的广延边际,36.3%来自既有贸易组合的集约边际。初期扩张主要体现为市场进入,与经贸协议和通关便利化降低固定合规成本的机制一致。
- 将出口额分解为货运净重与单位价值后,第3个月()的实物数量增长贡献为99.5%,第6个月()为94.0%。出口扩张主要由实物货运量增加构成,支持制度性合作通过跨境货物流动影响贸易的解释。
五、指数特征与实证结果
1. Measuring institutional trade cooperation
Trade policy uncertainty and institutional cooperation affect the conditions for cross-border exchange. Building on the text-based measurement approach of Baker, Bloom and Davis (2016), CA-TECI measures news coverage of trade agreements, reciprocal tariff concessions, customs facilitation and cross-border infrastructure cooperation. The index supports analysis of changes in institutional cooperation and their relationship with trade flows in Central Asia.
The Central Asia Trade and Economic Cooperation Index (CA-TECI) uses the same sample as CA-TPU: 3,084,775 Russian-language articles from eight outlets in Kazakhstan, Uzbekistan, Kyrgyzstan and Tajikistan, covering January 2013 to September 2026. Both indices use a common base period while measuring distinct dimensions of the trade policy environment.
2. News sample and reference population
CA-TECI uses international trade policy coverage as its reference sample to reduce sensitivity to changes in the volume of social and entertainment reporting. Excluding articles on domestic municipal utility charges yields 32,340 reference articles, . Of these, 6,591 meet the cooperation criteria, , corresponding to 20.38% of the reference sample.
| Country | News outlet | Total articles | International trade policy articles () | Cooperation articles () | Base-period mean share (%) | Base-period SD (percentage points) | Empirical Bayes weight () |
|---|---|---|---|---|---|---|---|
| Kazakhstan (KZ) | Kazinform | 800,664 | 9,472 | 2,299 | 20.47 | 4.68 | 11.21% |
| Forbes Kazakhstan | 147,518 | 3,489 | 496 | 13.06 | 3.78 | 15.29% | |
| Uzbekistan (UZ) | Kun | 295,041 | 3,701 | 594 | 14.54 | 5.42 | 9.43% |
| UzA (National Agency) | 166,464 | 2,824 | 1,013 | 30.29 | 5.12 | 10.25% | |
| Kyrgyzstan (KG) | 24 News Agency | 386,704 | 4,209 | 555 | 13.38 | 4.01 | 13.45% |
| Kaktus Media | 1,090,618 | 3,795 | 428 | 11.15 | 4.34 | 12.22% | |
| Tajikistan (TJ) | Asia-Plus | 114,578 | 2,850 | 580 | 19.86 | 3.93 | 13.87% |
| Avesta | 83,188 | 2,000 | 626 | 30.69 | 3.81 | 14.28% | |
| Regional total / pooled benchmark | 3,084,775 | 32,340 | 6,591 | 17.85 | 3.23 | 100.00% | |
3. Human validation and sensitivity to outlet composition
Two researchers independently coded a double-blind stratified sample of 600 Russian-language articles, including 450 observations in the main sample and 150 supplementary observations containing trade restriction or municipal utility terms. Horvitz–Thompson inverse-probability weighting yields a precision estimate of 86.7%, recall of 86.2% and an score of 86.5%. Inter-coder agreement is . Indices constructed by excluding one outlet at a time have correlations of with the benchmark.
KEY ECONOMETRIC FINDINGS
Key econometric findings
Local projections associate higher CA-TPU with export contraction and higher CA-TECI with export expansion.
Cooperation and export expansion
h = 6 · p < 0.01
A one-standard-deviation increase in CA-TECI is associated with a cumulative export increase of 16.6% at six months, controlling for exchange rates, commodity prices, destination industrial output and seasonality.
Market entry and the extensive margin
h = 3 · intensive margin: 36.3%
New product–destination relationships account for most early export growth, consistent with lower fixed compliance costs through agreements and trade facilitation.
Physical shipment growth
h = 3 · 94.0% at h = 6
Decomposing export value into net weight and unit value attributes most expansion to greater shipment volumes, supporting cross-border goods flows as a channel linking cooperation to trade.
4. Export responses and margins of trade
Local projections (Jordà, 2005) use 160,722 observations at the eight-digit product, destination and month level. A one-standard-deviation increase in CA-TECI is associated with a cumulative export increase of 16.6% at six months (; ). At three months (), new product–destination relationships account for 63.7% of export growth, while expansion within existing relationships accounts for 36.3%. Physical shipment growth contributes 99.5% of the increase in export value at three months and 94.0% at six months. These estimates support market entry and greater shipment volumes as channels linking cooperation to trade.
5. Index properties and empirical results