
In October 2026, the CA-TPU index rose to 170.53, up 41.55% from September and its highest level since June. Uzbekistan accounted for approximately 89% of the increase in the regional index. Its index still rose by 68.65% after international press roundups were excluded (Section 2). The increase in Kyrgyzstan’s component mainly reflected a change in the composition of sampled media; the index for a fixed set of outlets declined slightly (Section 1). Changes affecting trade and business activity centred on product-specific access for agricultural goods and building materials, verification of parties involved in cross-border payments, and financing for railways and electricity networks. With the intensity of Uzbek coverage falling below its monthly average towards the end of October, we expect the regional index to decline from its elevated level in November.
1. The index continues to rise, with Uzbekistan contributing most of the increase
Following increases in August and September, the CA-TPU index gained another 50.06 points in October. The three-month moving average, including the current month, rose from 105.76 in September to 130.88, indicating sustained growth in media attention to trade policy and uncertainty. The October index remained below May’s level of 187.46.
All four country components increased from September. Uzbekistan’s component gained 138.04 points, contributing 44.54 points to the regional increase, or approximately 89% of the total. Kazakhstan contributed 1.98 points, Kyrgyzstan 1.04 points and Tajikistan 2.49 points.
| Country | September index | October index | Monthly change | Contribution to regional change (points) |
|---|---|---|---|---|
| Kazakhstan | 43.40 | 46.86 | +7.97% | +1.98 |
| Uzbekistan | 268.12 | 406.16 | +51.48% | +44.54 |
| Kyrgyzstan | 91.33 | 107.96 | +18.21% | +1.04 |
| Tajikistan | 79.66 | 138.07 | +73.33% | +2.49 |
Note: Country components are normalized using each country’s base period and measure changes in media coverage intensity over time. Rounding accounts for the 0.01-point difference between the sum of contributions and the regional change.
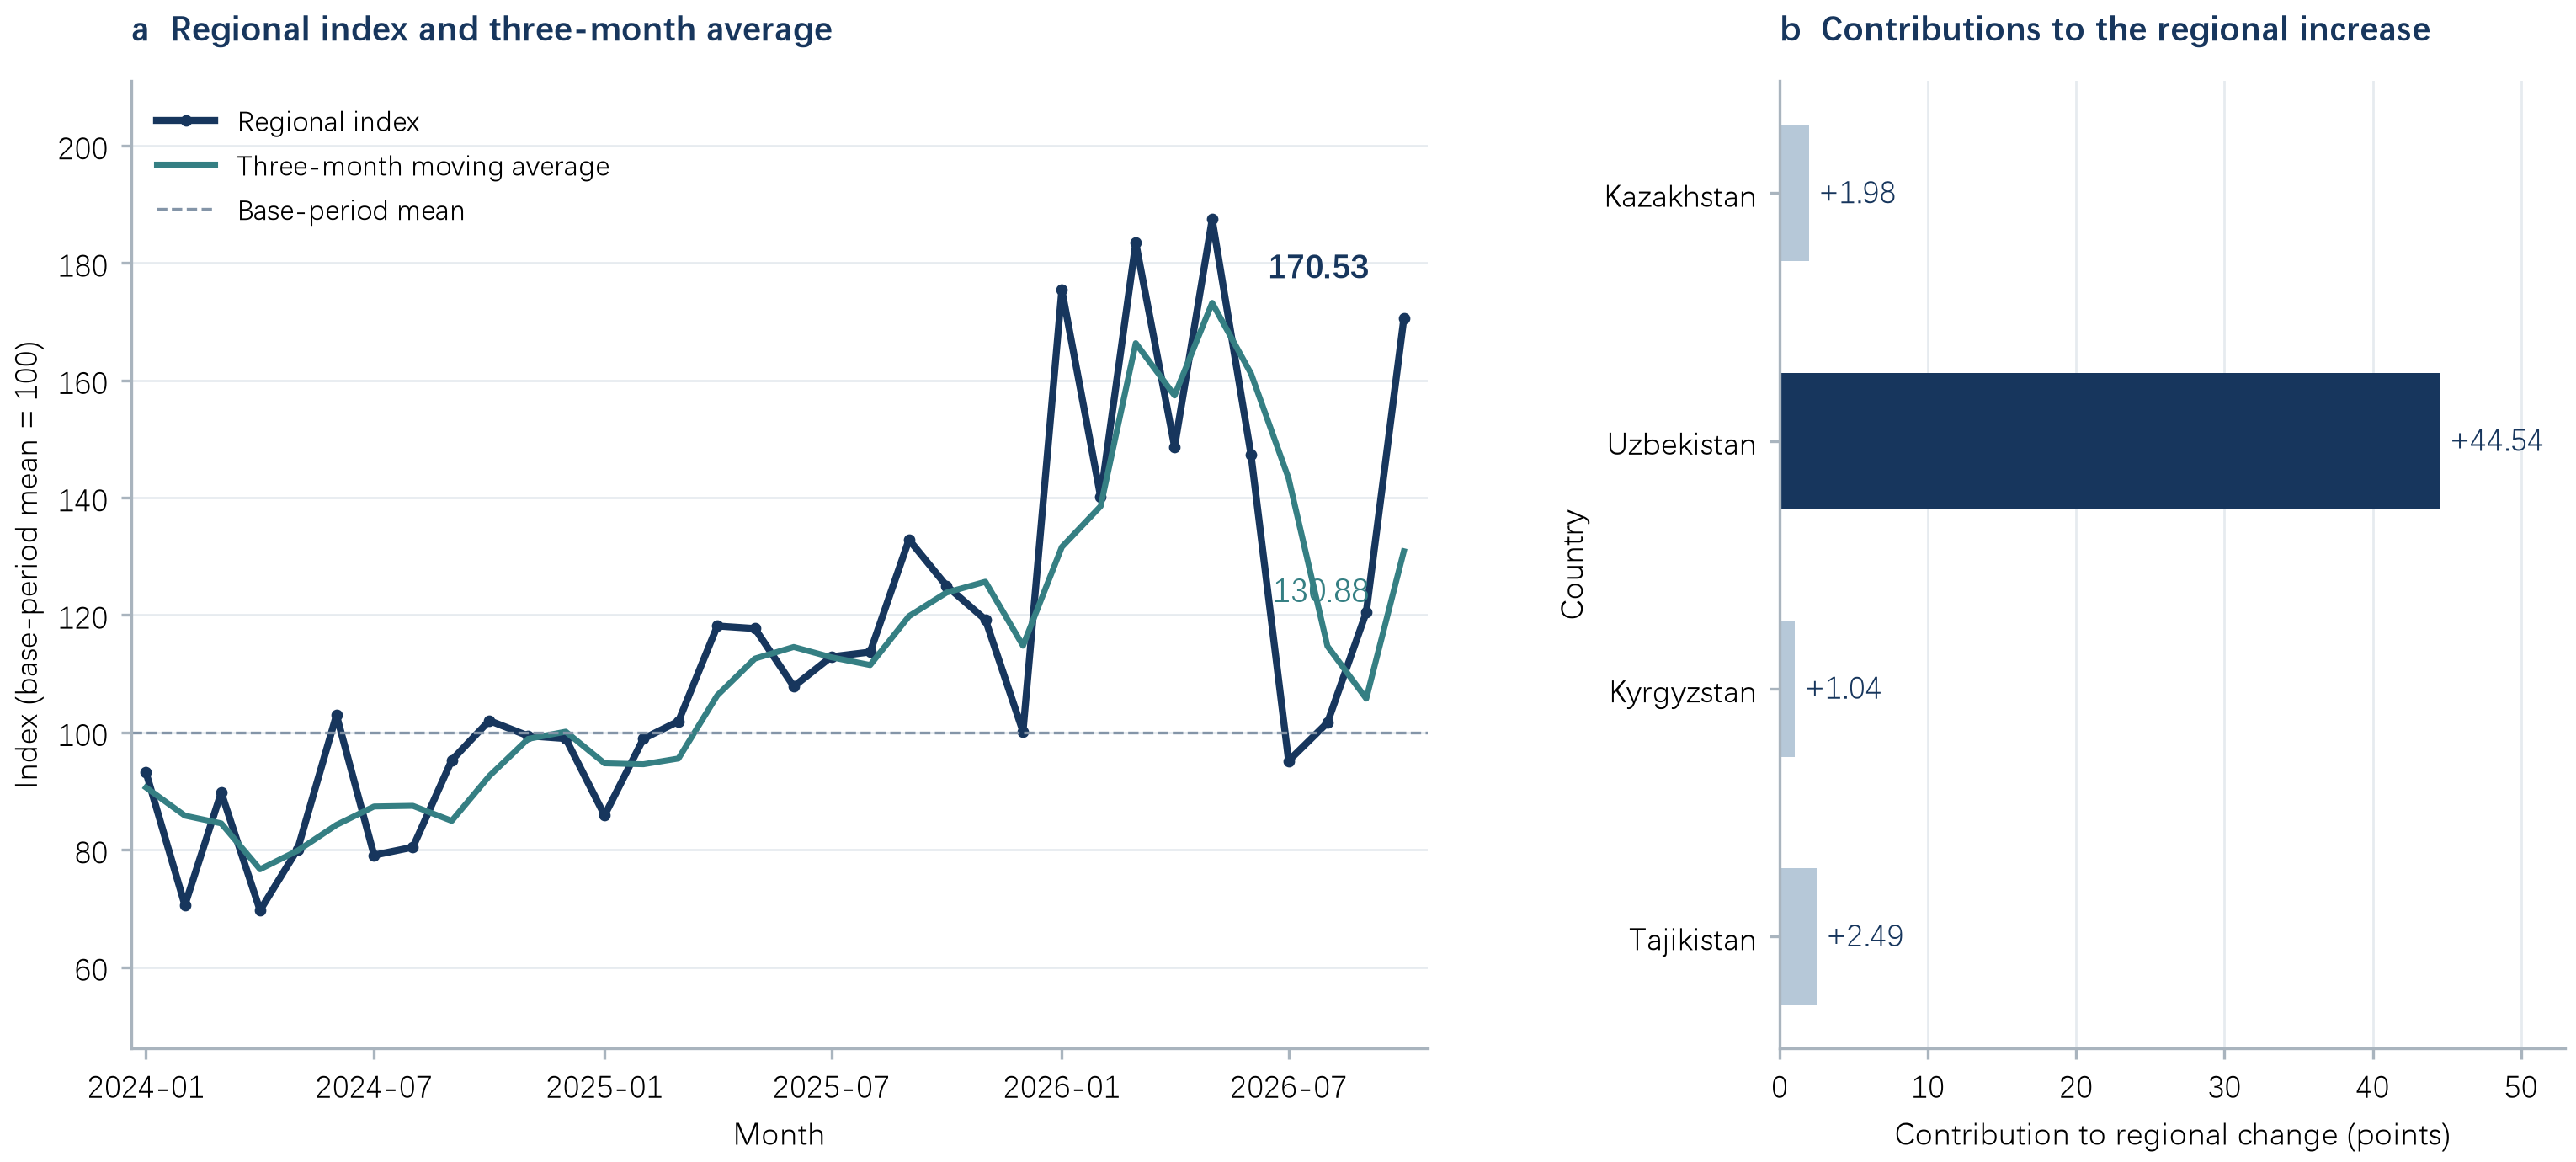
Note: a shows the regional index and its three-month moving average, including the current month, from January 2024 to October 2026. b shows country contributions to the regional increase in index points. The 0.01-point difference between their sum and the total increase reflects rounding.
The October sample contained 255 reports discussing trade, policy and uncertainty together, compared with 227 in September. Their share of reports discussing at least one of these topics rose from 4.21% to 5.54%. In Uzbekistan, reports covering all three topics increased from 45 to 82, while reports covering at least one topic increased from 690 to 830. The faster growth of the former raised the country component; Section 2 decomposes this increase by reporting category.
Kyrgyzstan’s component rose by 18.21%, mainly reflecting a change in the composition of media sources. For one sampled outlet, collection records were available only for 1–4 October. Its reports covering at least one topic fell from 1105 in September to 95 in October, reducing its share of the corresponding Kyrgyz total from 58.75% to 10.41%. Reports covering all three topics accounted for 2.62% of this outlet’s relevant coverage in September and 3.16% in the available October records, below the share at the other, continuously collected outlet in both months. The declining weight of this lower-share source raised the aggregate country component.
Restricting the calculation to media with complete records in both months leaves 32 reports covering all three topics in each month. Reports covering at least one topic increased from 776 to 818, reducing the share from 4.12% to 3.91%. Applying the official index’s base-period normalization coefficient, the index for this fixed media sample fell from 116.13 to 110.17, a decline of 5.13%. This moved in the opposite direction to the component calculated from all sources. The product-access and payment-verification measures discussed below describe changes in specific business conditions in Kyrgyzstan.
2. Growth in coverage and the main topics
The increase in Uzbek reports covering all three topics, from 45 to 82, can be divided between international press roundups and other reporting. Roundups contributed 12 additional reports and other reporting contributed 25. The roundup category’s share of reports covering all three topics fell from 44.44% to 39.02%.
| Reporting category | September: all three topics / at least one topic | October: all three topics / at least one topic | Additional reports covering all three topics |
|---|---|---|---|
| All reporting | 45 / 690 (6.52%) | 82 / 830 (9.88%) | +37 |
| International press roundups | 20 / 23 (86.96%) | 32 / 39 (82.05%) | +12 |
| Other reporting | 25 / 667 (3.75%) | 50 / 791 (6.32%) | +25 |
Note: Relevant reporting covers at least one of the three topics: trade, policy and uncertainty. Each percentage uses relevant reports within the same row as its denominator. Other reporting includes economic cooperation coverage and news involving third countries.
Excluding international press roundups in both months and applying the official index’s base-period normalization coefficient, Uzbekistan’s index rose from 154.09 to 259.87, an increase of 68.65%. Reporting outside the roundup category also contributed to the rise in discussion intensity. The fixed-media and category-exclusion calculations examine reporting composition; the official country components are shown in Section 1.
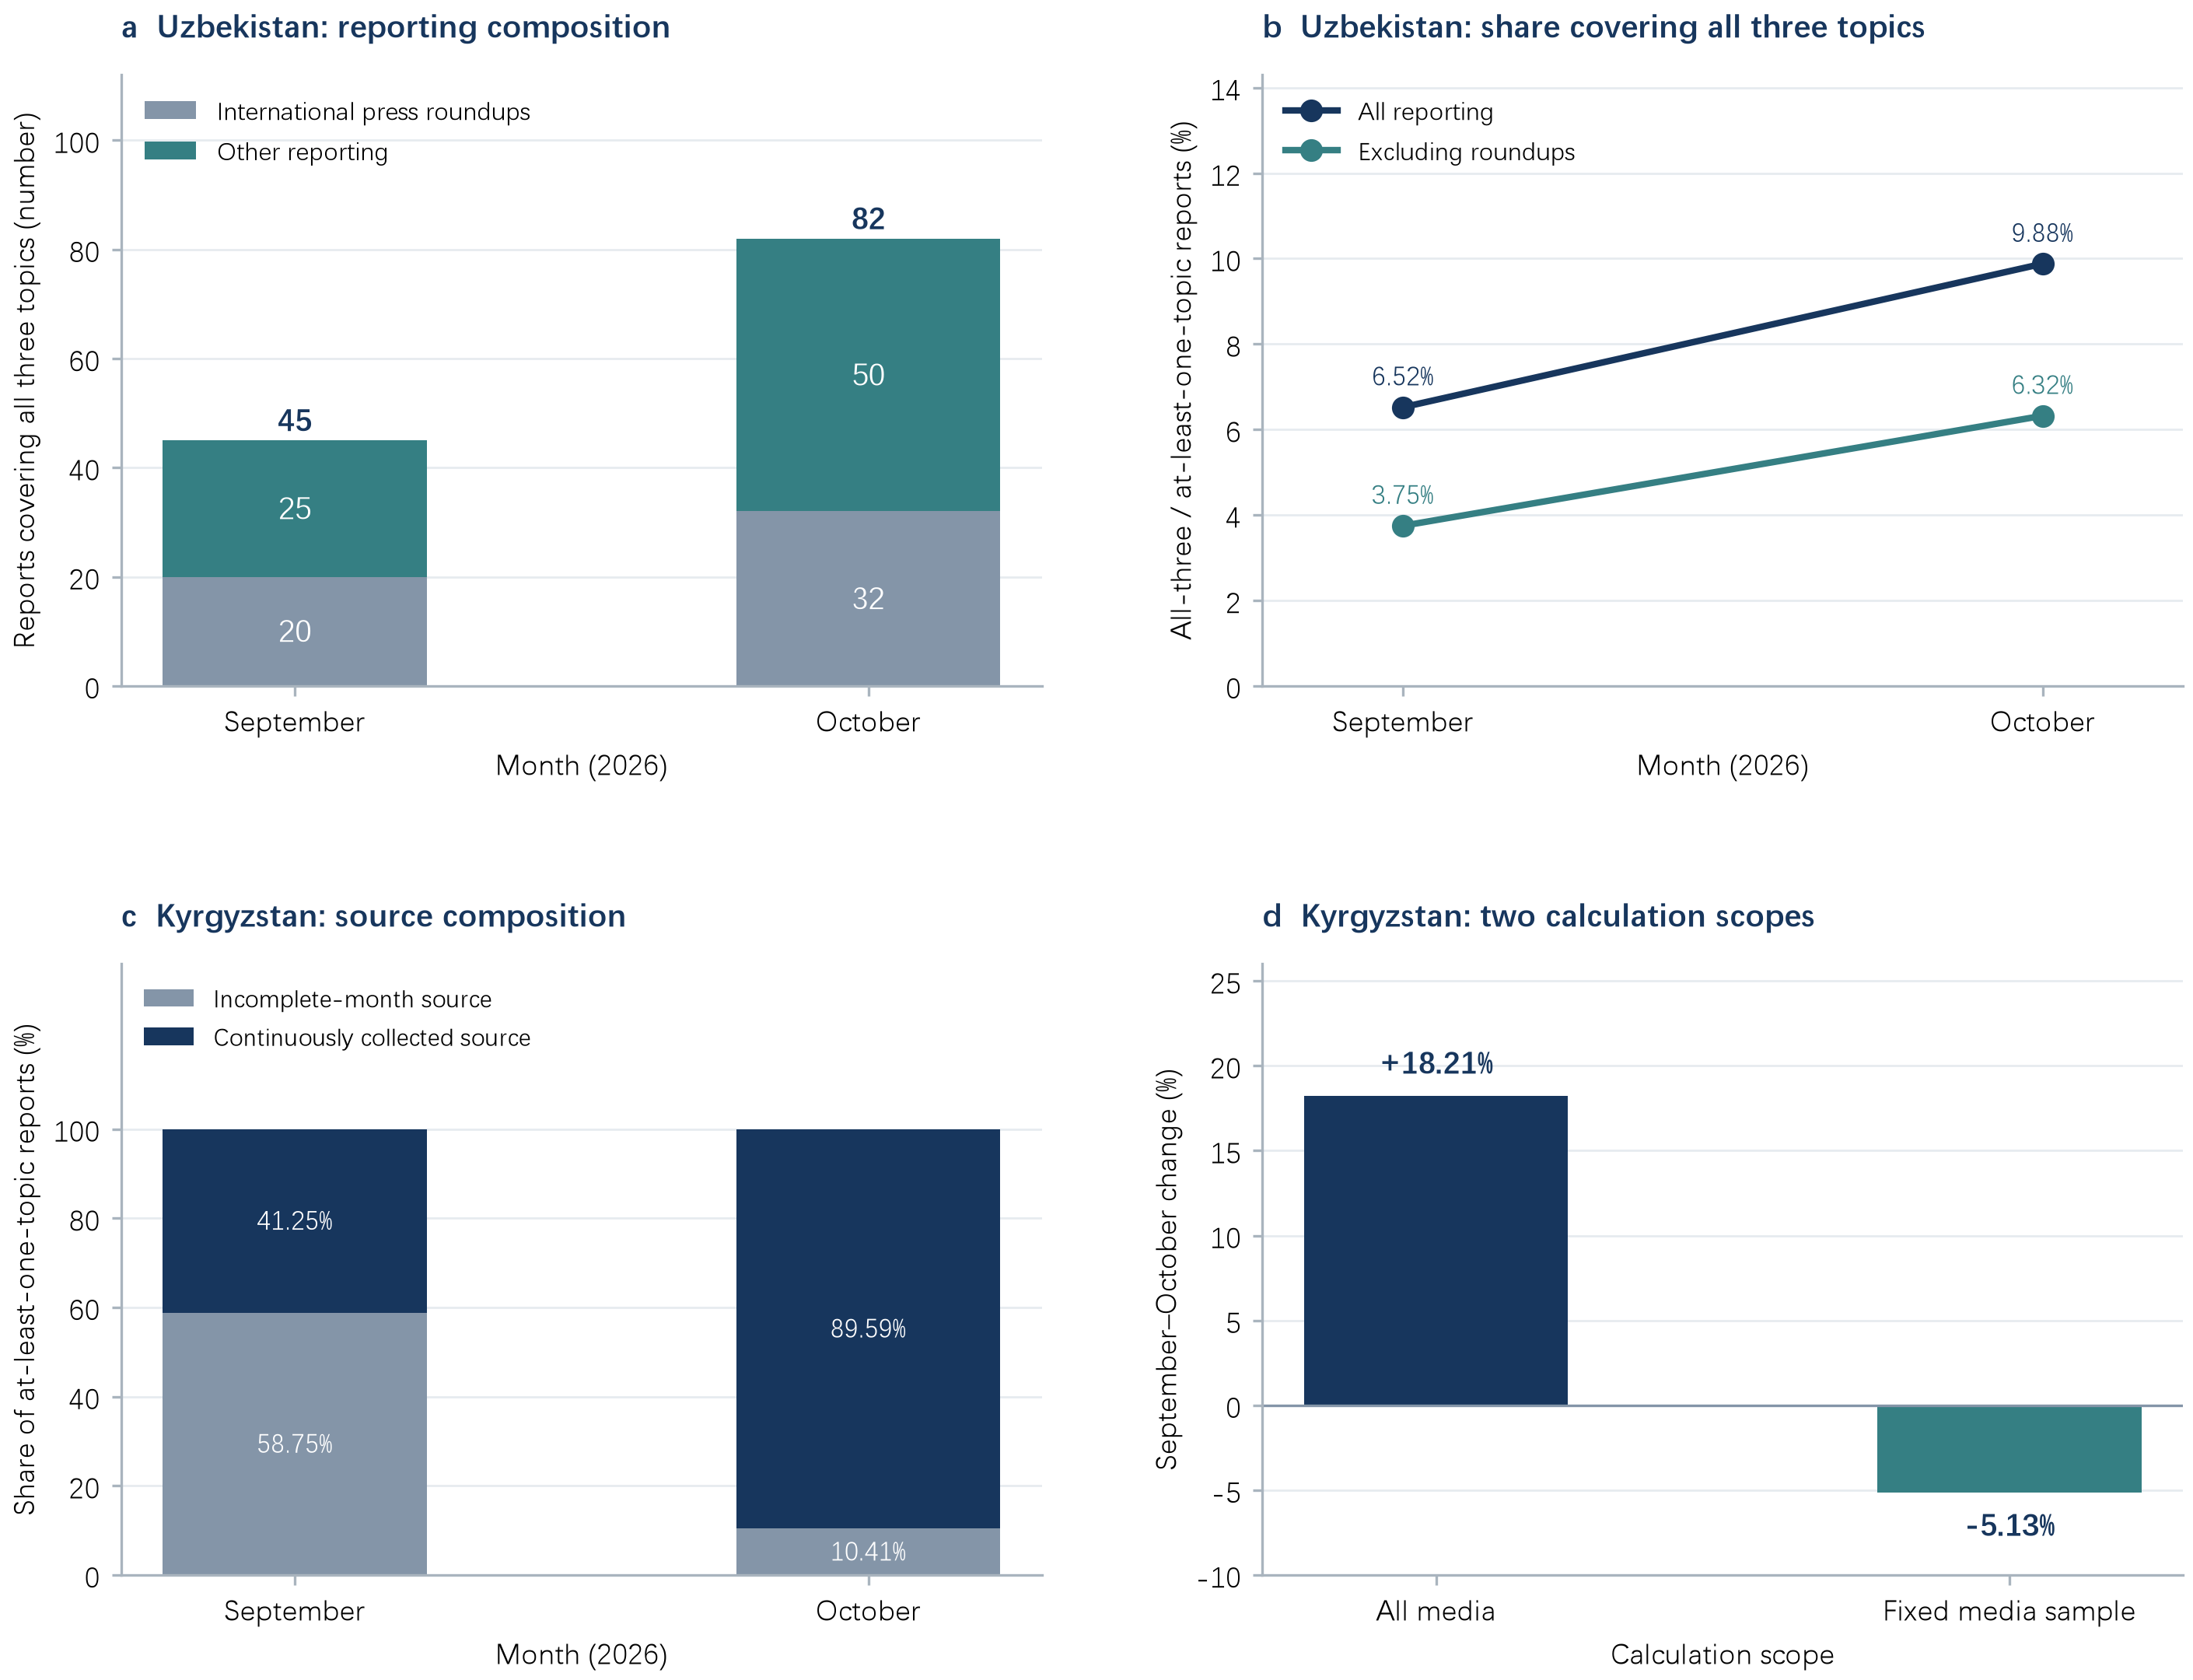
Note: a counts Uzbek reports covering all three topics. In b, the denominator is reports covering at least one topic within the corresponding category. In c, weights use the Kyrgyz total of reports covering at least one topic. d compares monthly changes for all media and a fixed media sample; the latter retains the official base-period normalization coefficient.
Sanctions terms were concentrated in international roundups. They appeared 87 times in Uzbek media in October, including 85 occurrences in this category. Coverage included the Russia–Ukraine conflict and sanctions on third countries, reflecting Uzbek media attention to external policy changes.
Across reports covering all three topics, the number containing trade terms increased from 127 to 145. Their share remained at approximately 56%–57%, while total occurrences fell from 493 to 432, indicating fewer repeated mentions within individual reports. Agreement-related terms increased from 168 to 251 occurrences across 89 reports, corresponding to the month’s concentration of economic cooperation announcements.
| Keyword category | September occurrences | October occurrences | October reports containing the terms |
|---|---|---|---|
| Trade | 493 | 432 | 145 |
| Exports | 132 | 176 | 82 |
| Agreements | 168 | 251 | 89 |
| Sanctions | 152 | 119 | 45 |
Note: The sample consists of reports discussing trade, policy and uncertainty together in each month. A report may contain terms from several categories, so the report counts cannot be added across categories. Occurrences include repeated mentions within a report.
On 19 October, Uzbekistan’s president announced at the Uzbekistan–United States Business and Investment Council meeting that the two sides had developed 54 cooperation arrangements and prospective initiatives worth approximately US$12 billion, with an implementation action plan to follow. On 22 October, Uzbekistan and the Eurasian Economic Commission discussed closer alignment of technical regulation and a new cooperation programme. On 30 October, the Organization of Turkic States summit in Ankara adopted a declaration, and Uzbekistan proposed joint industrial investment and commercial judicial cooperation initiatives. These reports addressed areas of cooperation and project implementation. Financing and procurement progress will shape when the plans translate into investment and orders.
Uzbekistan’s trade performance provides a market context for these cooperation initiatives. Data for the first three quarters, released on 28 October, showed non-gold merchandise exports of US$13.33 billion, up 31.6% year on year, while imports of goods and services rose by 15.7%. Total exports of goods and services fell by 5.5%, mainly because exports of non-monetary gold declined from approximately US$9.8 billion to US$2.8 billion. For suppliers serving Uzbekistan, industry-level sales and customer payments provide a closer indication of specific business demand than aggregate exports.
Payment-compliance news from Kyrgyzstan offers more direct evidence on business operations. An official statement released on 27 October reported that, as of 20 October, 52 legal entities had ceased operations, 57 remained in compulsory liquidation and state-owned banks had closed more than 240 accounts as part of broader sanctions-risk management. For firms settling trade through Kyrgyzstan, payment intermediaries’ operating status and bank verification requirements have become practical conditions for contract performance.
3. Product-specific market-access changes shape import arrangements
Kyrgyzstan adjusted agricultural and building-material import policies in different directions during October. A six-month import ban on potatoes under a specified tariff code took effect on 20 October, with exceptions for transit and qualifying goods already in shipment. A decision adopted on 27 October set an apple import ban lasting until 1 February 2027; its start date follows the waiting periods after official publication and the decree’s entry into force. Exemptions for apples shipped before the ban takes effect also require confirmation from the agricultural authority to customs. These measures will reduce import competition for local autumn crops and narrow the window for new import orders.
On 28 October, Kyrgyzstan adopted another decision lifting earlier import restrictions on certain building materials. The affected products include some blocks and bricks, as well as specified glass and cable products. Restored access to some imported supplies will help construction projects address constraints on procurement sources. Agricultural restrictions and building-material liberalization move in opposite directions: market access is being adjusted product by product, making the applicable tariff code central to procurement decisions.
Kazakhstan’s customs-enforcement news shows how the application of existing rules also affects import compliance costs. Information released on 16 October on inspections in the first three quarters attributed 40% of detected violations to inaccurate customs valuation and 20% to classification issues. Authorities were also checking compliance with anti-dumping duties for certain flat-rolled products imported from China. For the suppliers and importers concerned, evidence supporting contract prices and product classification directly affects the risk of additional tax assessments.
4. Logistics and energy investment expands, with near-term costs shaped by implementation
The Darbaza–Maktaaral railway has entered the later stages of construction. According to the Asian Infrastructure Investment Bank, work on the approximately 115-kilometre line began in March 2024, reached 78% completion by July 2026 and was scheduled for completion by year-end. The loan of up to US$135 million attracting attention in October remained at the proposal stage. Once operational, the line will add a rail connection between Kazakhstan and Uzbekistan and ease capacity constraints on existing routes.
Expansion along the Trans-Caspian route is already evident in freight volumes. Information released by Kazakhstan in October showed that freight on the Trans-Caspian International Transport Route rose by 30% year on year in the first three quarters. Higher volumes increase pressure on sea–rail connections, creating demand for fleet expansion and port dredging. For shippers, whether new facilities deliver more reliable schedules will affect bookings and inventory arrangements earlier than planned capacity alone.
Energy-sector developments affect both investment projects and day-to-day production. Kazakhstan plans to attract approximately €18 billion through an energy-transition platform covering new renewable generation and electricity-network upgrades, with the platform scheduled to launch in November. Project financing and tenders will progressively generate procurement demand for grid equipment. Uzbekistan exported 3.4 billion kWh of electricity and imported 1.9 billion kWh in the first three quarters, recording net exports of 1.5 billion kWh. Cross-border electricity flows help balance supply and demand. As winter approaches, industrial production plans still need to account for local network capacity and supply arrangements.
On 23 October, the National Bank of Kazakhstan announced a 50-basis-point rate cut, taking the base rate to 15.75% from 27 October. It also indicated that another adjustment before year-end was unlikely. As the cut feeds into new or renewed loan contracts, importers’ inventory-financing interest costs will fall. Existing fixed-rate loans remain subject to their original terms.
Some financing for Tajikistan has reached the agreement and disbursement stages. Loan and grant agreements signed with the European Bank for Reconstruction and Development on 27 October totalled €62.45 million for water supply and mountain roads, including €52.85 million for the Baljuvon–Sari Khosor road. On 30 October, the Eurasian Fund for Stabilization and Development disbursed the first US$100 million under a US$200 million programme signed in August. The programme provides for three disbursements in 2026–2027, with a 20-year maturity, 1% annual interest and a 10-year grace period, supplying concessional funding for budget expenditure and macroeconomic adjustment.
5. November outlook: a lower index, with market-access and payment rules continuing to affect trade
We expect the November CA-TPU index to be below October’s level. In Uzbek media, which contributed most of the increase, the share of reports covering all three topics remained elevated in the early reporting intervals, reached 12.00% around mid-month and then declined to 8.92% and 7.45%. The full within-month distribution is shown below.
| October interval | Days | Reports covering all three topics | Reports covering at least one topic | Share covering all three topics |
|---|---|---|---|---|
| 1–4 October | 4 | 8 | 69 | 11.59% |
| 5–11 October | 7 | 20 | 185 | 10.81% |
| 12–18 October | 7 | 21 | 175 | 12.00% |
| 19–25 October | 7 | 19 | 213 | 8.92% |
| 26–31 October | 6 | 14 | 188 | 7.45% |
| Full month | 31 | 82 | 830 | 9.88% |
Note: The table covers two sampled Uzbek outlets. Each percentage uses reports discussing at least one relevant topic in the same interval as its denominator. The first and last intervals are incomplete weeks. With 8–21 reports covering all three topics in each interval, the percentages describe the within-month distribution.
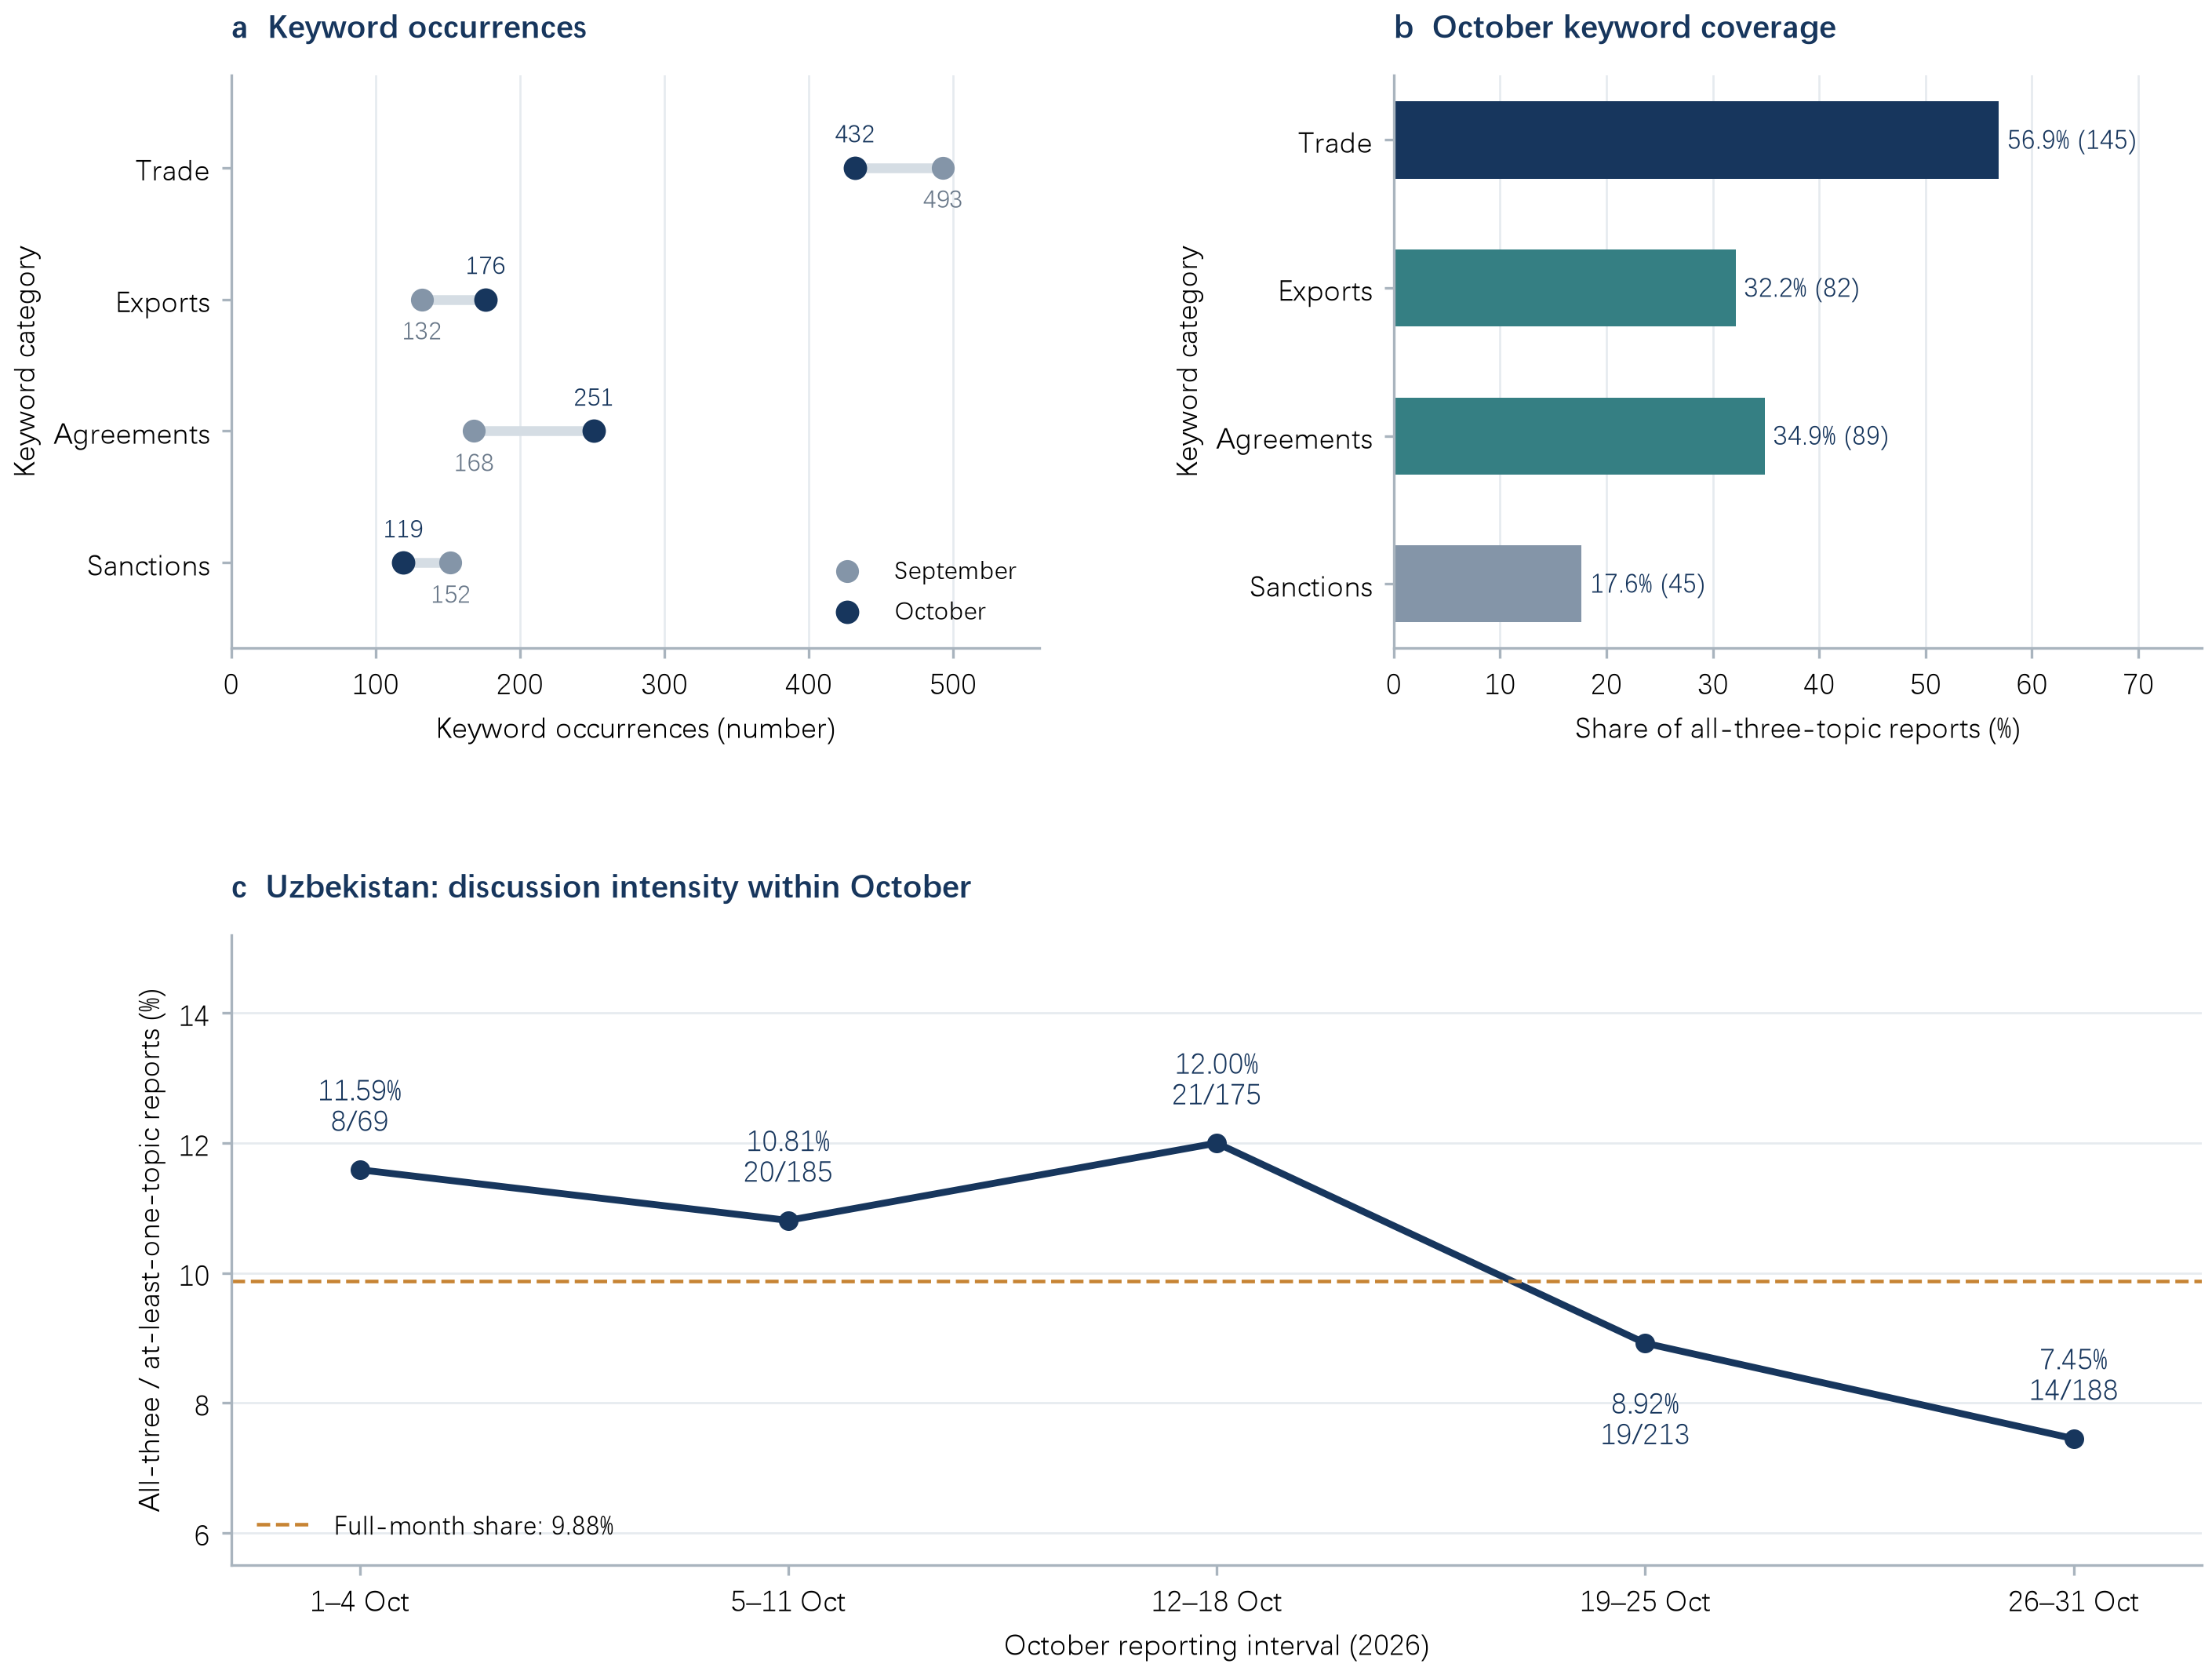
Note: a counts keyword occurrences, including repetitions within a report. b uses 255 October reports covering all three topics as its denominator; parentheses show report counts and categories may overlap. In c, annotations show all-three-topic reports / at-least-one-topic reports. The first and last intervals are incomplete weeks.
The decline occurred late in the month. The final two intervals were both below the full-month share of 9.88%, indicating that discussion intensity at the main source of the increase had weakened by month-end and providing a recent basis for the November outlook. Following the concentration of meetings, coverage is expected to shift towards project implementation, reducing the influence of clustered agenda announcements. New sanctions decisions and trade negotiations are the principal developments that could concentrate coverage again and raise the index.
Two confirmed measures in Uzbekistan will directly affect operating costs in November. Article 19 of the presidential decision on transport and logistics adopted on 12 October cuts customs-clearance fees for international express consignments by 20% from 1 November. Article 8 of the presidential decree on business operating conditions issued on 27 August reduces electricity and natural-gas prepayments to 15% of monthly consumption from 1 November for firms meeting automatic-metering, remote-disconnection and reconnection, and payment-discipline requirements for the preceding two months. The reduction releases working capital tied up in energy payments. Kyrgyzstan’s agricultural restrictions will continue to affect seasonal orders, while resumed imports of some building materials restore scope for competitive quotations. For trade settled through Kyrgyzstan, the time needed to verify account status and payment documentation will affect shipment and collection schedules.
Infrastructure investment will continue to generate demand for equipment and engineering services. Near-term November milestones include the proposed concept review of the Kazakhstan–Uzbekistan railway loan on 27 November and the planned launch of the energy-transition platform. Tender announcements following Tajikistan’s road-financing agreements will specify procurement packages and contract schedules.
Data transparency and reproducibility
The accompanying data transparency and reproducibility package contains monthly indices, news counts, keyword summaries, figures in three languages and plotting scripts. Readers can check the principal statistics and reproduce the figures. The package is available in the attachments on this report’s webpage and does not include full news articles.
About the CA-TPU index
CA-TPU (Central Asia Trade Policy Uncertainty Index) was developed by Professor Lijie Zhang’s team at the School of Economics and Management, Xinjiang University. Based on the economic policy uncertainty methodology of Baker, Bloom and Davis (2016), it covers major Russian-language media in Kazakhstan, Uzbekistan, Kyrgyzstan and Tajikistan. The index measures the intensity with which mainstream media in these four countries jointly discuss trade, policy and uncertainty. It uses 2015–2019 as the base period, with the base-period mean normalized to 100, and is released monthly. Full methodological documentation, historical data and reports in three languages are available on the Central Asia Trade Indices website at https://cati.caiees.cn/.
This report is a non-profit academic publication with independent funding. It does not constitute investment advice or a basis for commercial decisions. Attribution: CA-TPU Index Project.
Cite this report
CA-TPU Index Project. (2026). CA-TPU Monthly Report (October 2026). School of Economics and Management, Xinjiang University. https://doi.org/10.62432/CATPU/2026-M10